High-frequency trading — finding the modelled executable edge
An order whose price is touched is not necessarily filled. Queue, delay, fees and adverse selection erase the apparent edge.
Best-price-and-volume order book, organization and outcomes are entirely synthetic. Audit demonstration, not evidence of a tradeable edge.
90,000 synthetic order-book eventsReading plan
From problem to decision
- 01
Understand one fill
Touched price, queue position and market event.
- 02
Reproduce the bias
The first test treats almost every touch as a trade.
- 03
Restore reality
Queue, latency, fees and post-fill price movement.
- 04
Define the next test
Detailed order-book data and shadow operation before production.
01
Before we begin
The problem
A reconstructed organization is examining a passive strategy driven by the imbalance between visible buy and sell volume in the order book.
A market-making strategy posts limit orders and hopes to earn a fraction of the tick size. The signal may be right yet lose money if the order is not filled, arrives too late or is filled only when the market is becoming adverse.
This study reconstructs the difference between an edge visible in a formula and an edge actually accessible in an order queue.
02
Phase 1
What the organization built
We begin by understanding the system as presented, without caricaturing it and before proposing any correction.
What the first test assumes
The prototype posts a passive order at the best price. As soon as a market trade touches that price, the test considers the order fully filled.
This rule ignores orders already waiting ahead. It turns a simple price touch into a certain transaction and manufactures a 99.73% fill rate.
Why the large blue line is misleading
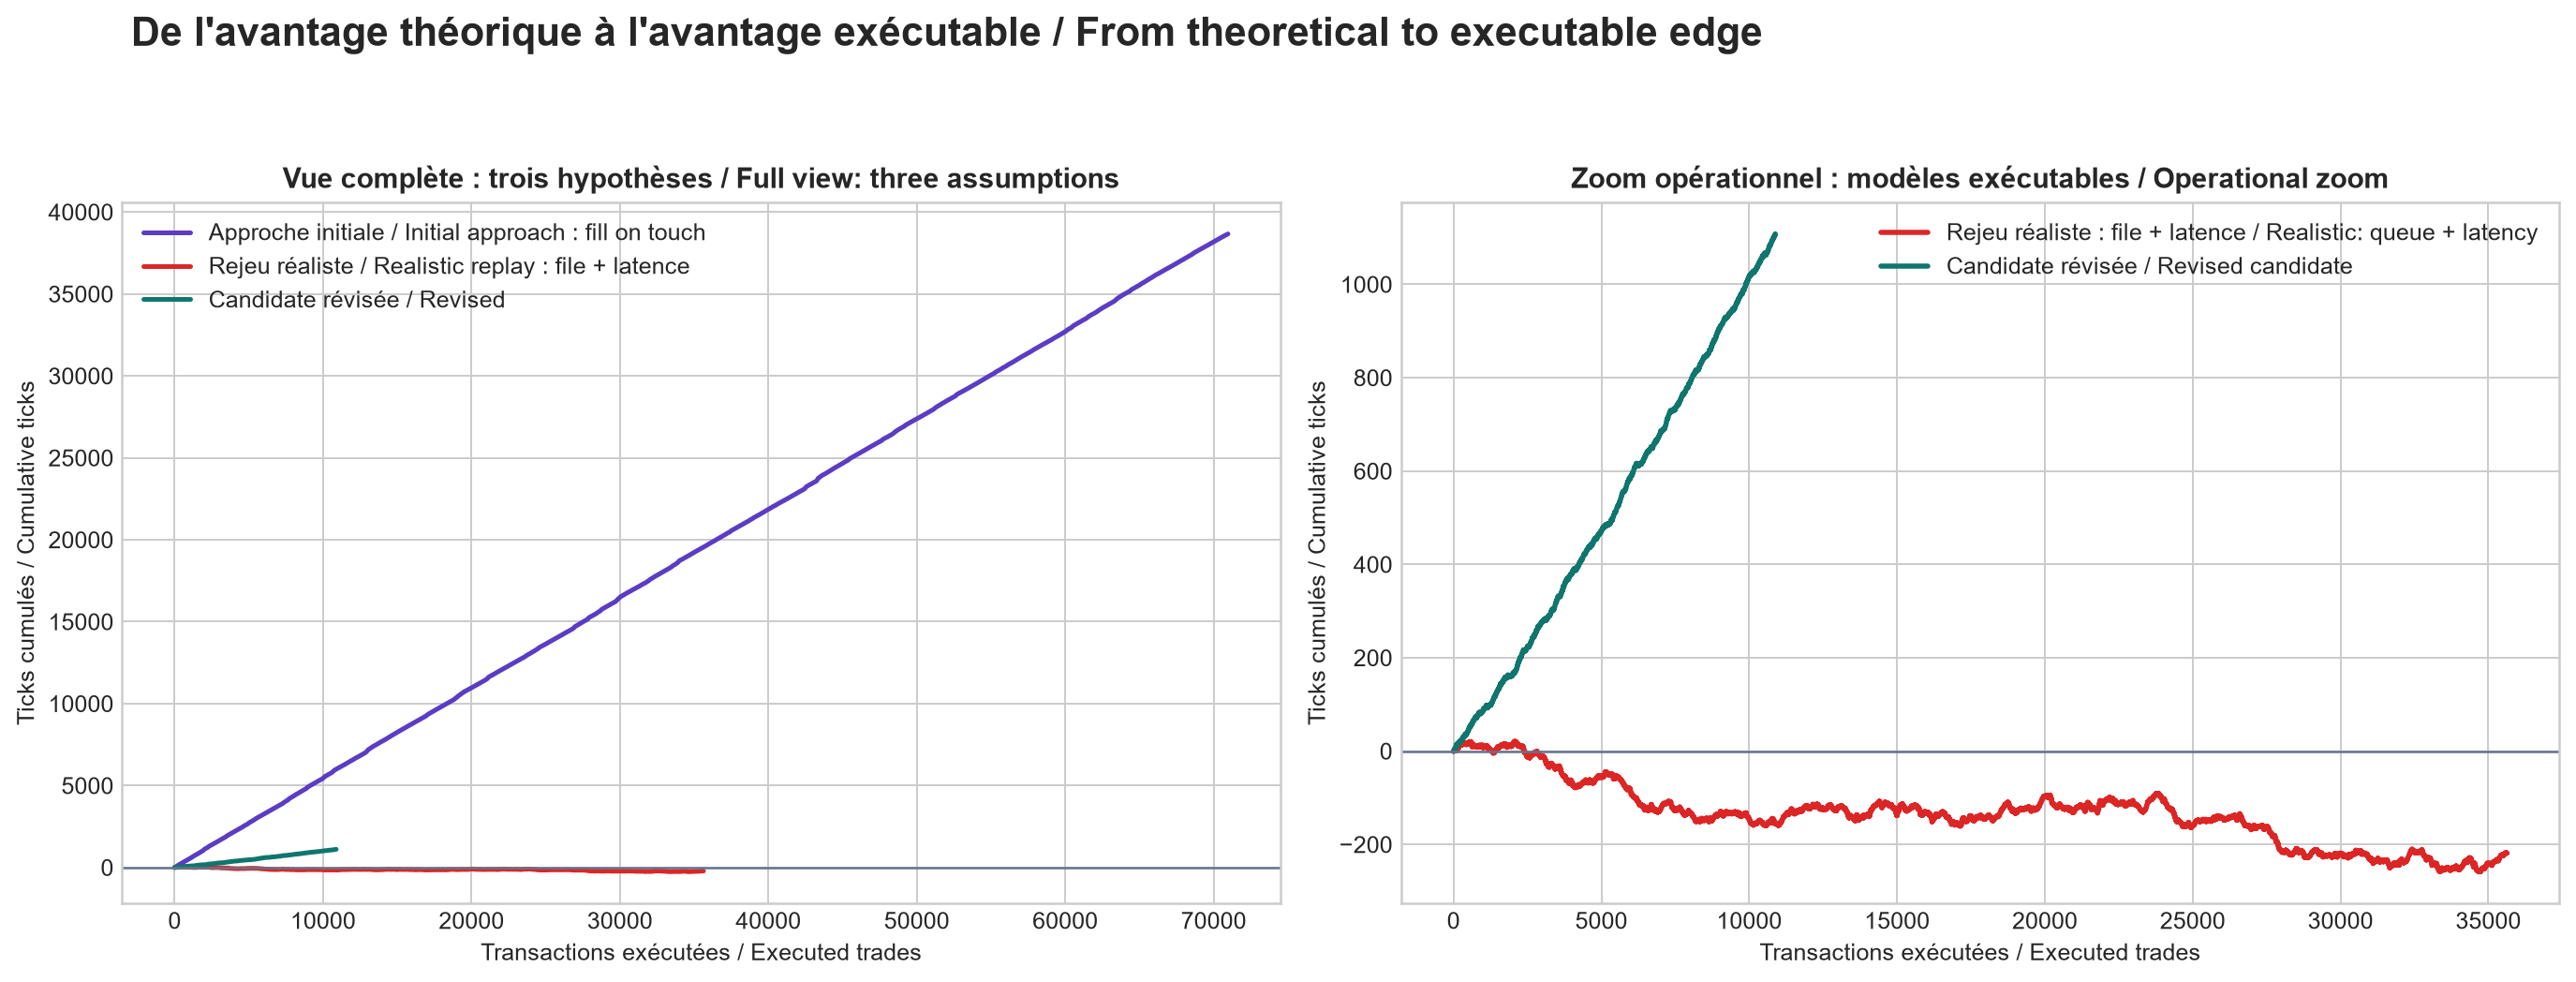
The blue line accumulates more than 70,000 assumed fills and nearly 40,000 ticks. It overwhelms the red and green lines because it counts trades that generally would not have been obtained.
The corrected visual keeps the full view to show the scale of the bias, then adds a separate zoom on the two operational models so their comparison can be read.
Initial approach summary
- An order is deemed filled as soon as its price is touched.
- The backtest reports a 99.73% fill rate and +0.545 net tick per trade.
- Queue position and latency are absent.
03
Phase 2
What the assessment checks and proposes
The second phase reproduces the mechanism, locates what breaks and turns criticism into a testable change.
Make execution credible
The realistic replay assigns a quantity of orders ahead of ours. It waits for that queue to be consumed, imposes four events of delay and deducts fees. The fill rate then falls to 50.07%.
It also measures price one, ten and fifty events after the fill. If price deteriorates immediately afterwards, the order was probably selected by a better-informed participant: this is adverse selection.
What the revised candidate changes
The revised rule requires a stronger signal, rejects unstable periods and limits volume ahead of the order. In this simulation, it recovers +0.102 net tick per fill.
This is not evidence of a tradeable profit. At eight events of latency the edge turns negative again, and the book is entirely synthetic with one random seed.
Assessment
- With the order queue, four events of delay, fees and adverse selection, the fill rate falls to 50.07%.
- Net gain becomes −0.006 tick per fill and −218.5 cumulative ticks.
- The revised rule turns positive in this simulation, but falls below zero at eight events of delay.
Proposed correction
- Stricter signal threshold and delay reduced to two events.
- Reject unstable, adversely selected or overly volatile signals.
- Do not place an order when already-prioritised volume ahead exceeds a threshold.
- Expected gain must exceed fees and modelled post-fill loss.
04
Concepts and equations
No symbol without a definition
The same notes open from the “?” links placed throughout the article.
05
Numerical results
What the numbers actually measure
These results belong to an order-book simulation. They measure the effect of execution assumptions; they do not announce a profit.
initial → realistic fill rate
Share of orders assumed, then realistically eligible, as filled.
net tick per fill
Average smallest-price-increment gain after modelled fees.
revised candidate, simulation
Positive result in the central synthetic scenario only.
latency where edge turns negative
Beyond this simulated delay, average gain falls below zero.
06 · See the evidence
Read the charts step by step
Each figure first explains how to read its axes and colours, then what it does—or does not—support.
From theoretical to executable edge
Both panels place executed-trade count on the horizontal axis and cumulative ticks on the vertical axis. A point is therefore the cumulative result after the nth fill, not the gain on that single trade. In the full view on the left, purple is the initial 'fill on touch' approach, red is the queue-and-latency replay, and dark teal is the revised candidate. Purple reaches about 38,800 ticks after 71,000 fills and forces a vertical scale near 40,000. The red line, around −220, and dark-teal line, around +1,100, are present but appear almost merged with zero because that large scale compresses them. The right panel removes purple and tightens the vertical axis from −300 to roughly +1,100 so red and dark teal become readable.
The zoom shows the realistic replay finishing negative while the revised candidate remains positive in the central scenario; it also explains why red and dark teal were almost invisible in the full view. We can conclude that most of the spectacular purple curve comes from the fill-on-touch assumption rather than an edge that survives operational reconstruction. We cannot naively compare the three endpoints as returns: fill counts differ, cumulative ticks are not euros, and all market dynamics are synthetic.
Initial test assuming execution on price contact
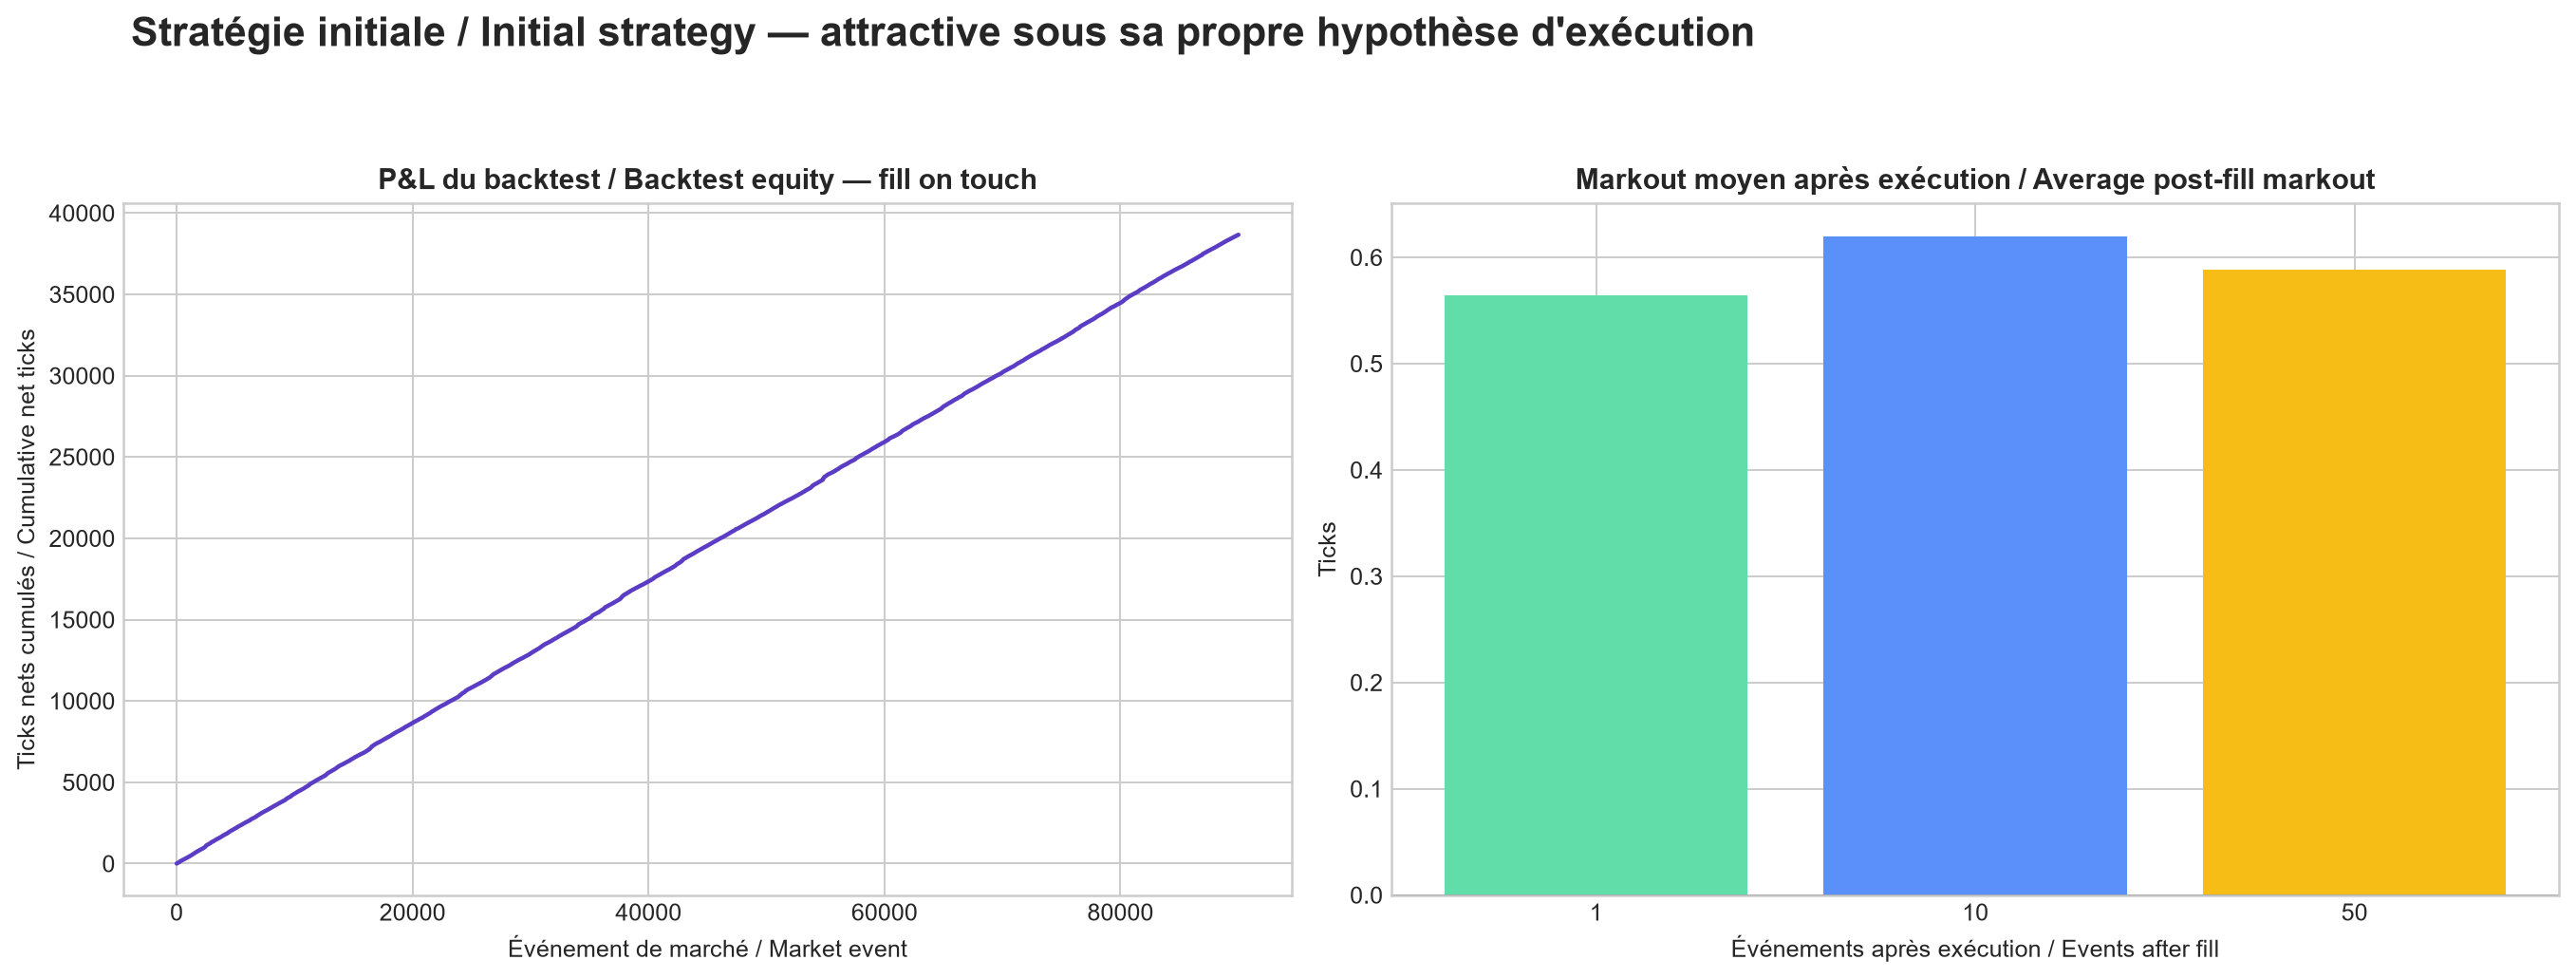
The figure has two panels. On the left, the horizontal axis counts market events up to 90,000 and the vertical axis accumulates net ticks assigned by the backtest. The purple line rises almost linearly to about 38,800 ticks; a point gives the cumulative level at that event. On the right, the horizontal axis distinguishes 1, 10 and 50 events after an assumed fill, and the vertical axis gives average markout in ticks. The mint, blue and yellow bars correspond to those three horizons, not three strategies; their heights are about 0.565, 0.620 and 0.589 ticks.
Under its own rule, the initial test combines a very smooth curve with positive markouts at all three horizons. We can conclude that the signal looks attractive if every simple price touch is counted as a fill. We cannot conclude that the strategy is executable or profitable: this panel models neither already-prioritised queue volume, decision delay, nor touched orders that are never served. The smoothness of the line is precisely a warning sign about that assumption.
Breakdown of modelled edge degradation
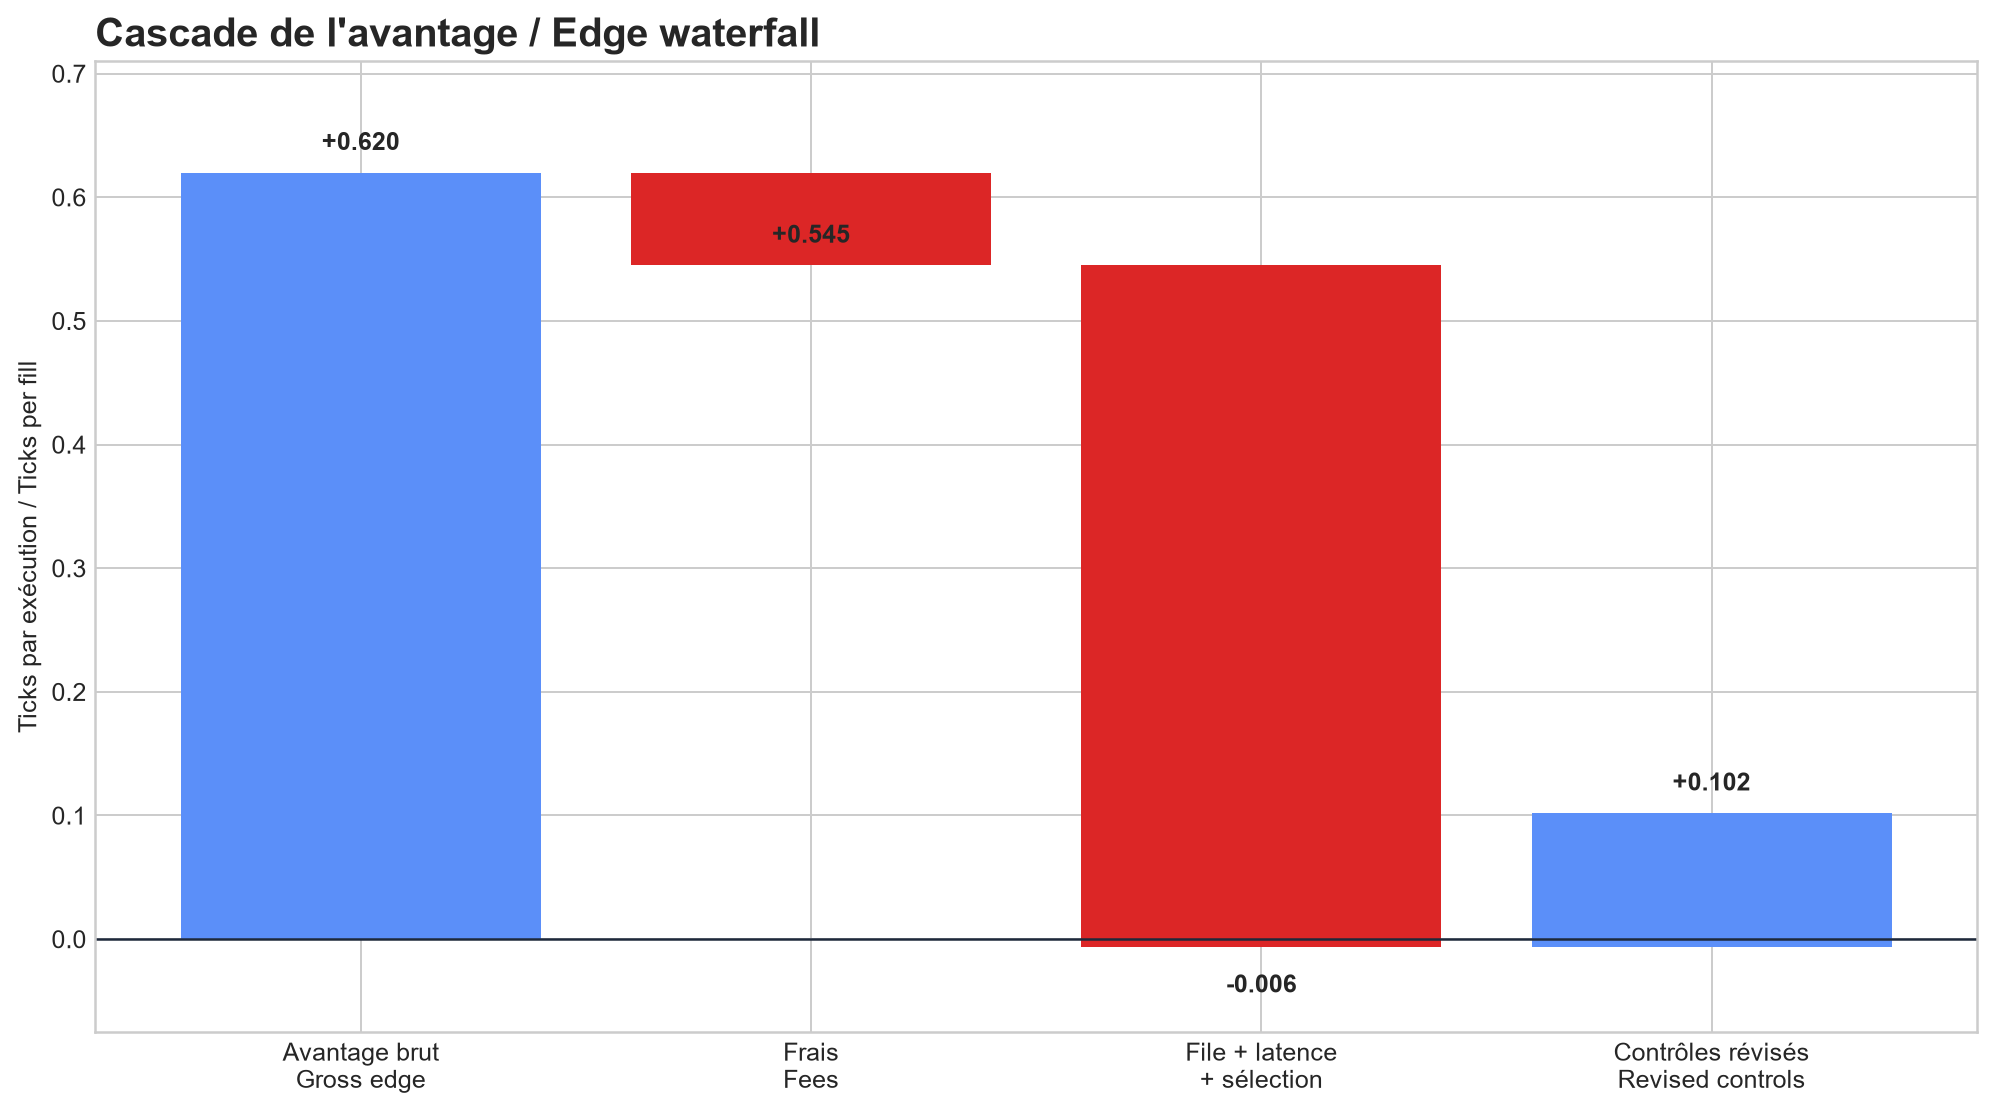
The figure has one panel. The horizontal axis lists four calculation stages and the vertical axis measures ticks per fill. These are waterfall bars: their vertical position connects one level to the next, so an isolated bar height is not the final result. The first blue bar runs from 0 to +0.620, the gross edge. The small red fee bar falls from +0.620 to +0.545. The large red 'queue + latency + selection' bar then falls from +0.545 to −0.006. The last blue bar rises from −0.006 to +0.102 after applying the revised rule; printed numbers mark successive levels.
Fees remove only 0.075 ticks, whereas execution reconstruction consumes about 0.551 ticks and is enough to make the result slightly negative; the revised candidate then recovers 0.108 ticks to finish at +0.102. We can conclude that queue and latency assumptions dominate this diagnosis, far more than fees. We cannot read the waterfall as independent causal attribution: the last two stages change several rules at once, and no bar is an uncertainty interval.
Post-fill price movement
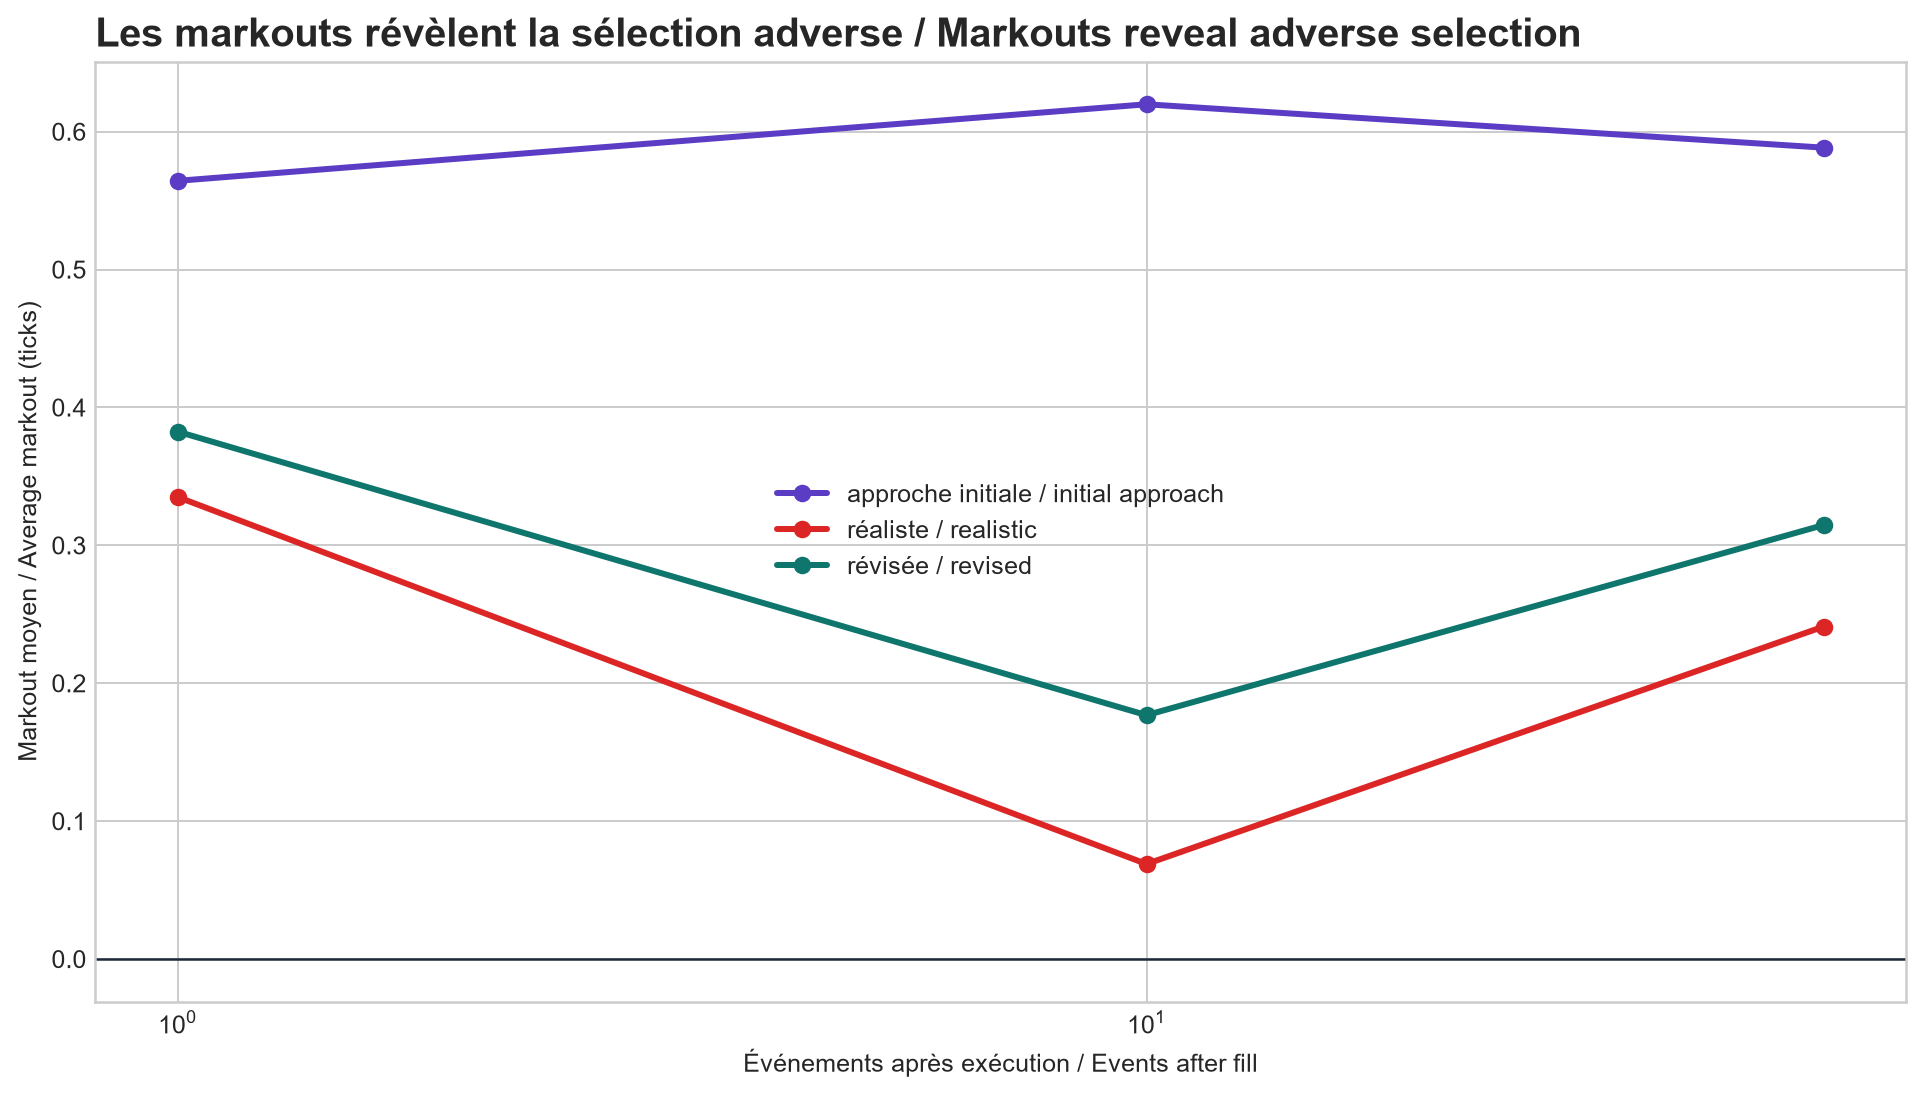
The figure has one panel. The horizontal axis gives the post-fill horizon—1, 10 and then 50 order-book events—on a logarithmic scale; the vertical axis is average markout in ticks. Purple is the initial approach, red the realistic replay and dark teal the revised candidate. Each point is the average signed move measured at that horizon, and the segments are only visual guides between three measurements. At 1, 10 and 50 events, purple is about 0.565, 0.620 and 0.589; red 0.335, 0.068 and 0.241; dark teal 0.382, 0.177 and 0.315.
Moving to realistic execution sharply reduces markout, especially at ten events; the revised rule recovers some of it without returning to the purple level. We can conclude that the initial result overstates the quality of selected fills and that the filters improve the realistic scenario. We cannot conclude that these three averages alone prove adverse-selection causality, net profitability or stability at other horizons: the data are simulated and no dispersion is shown.
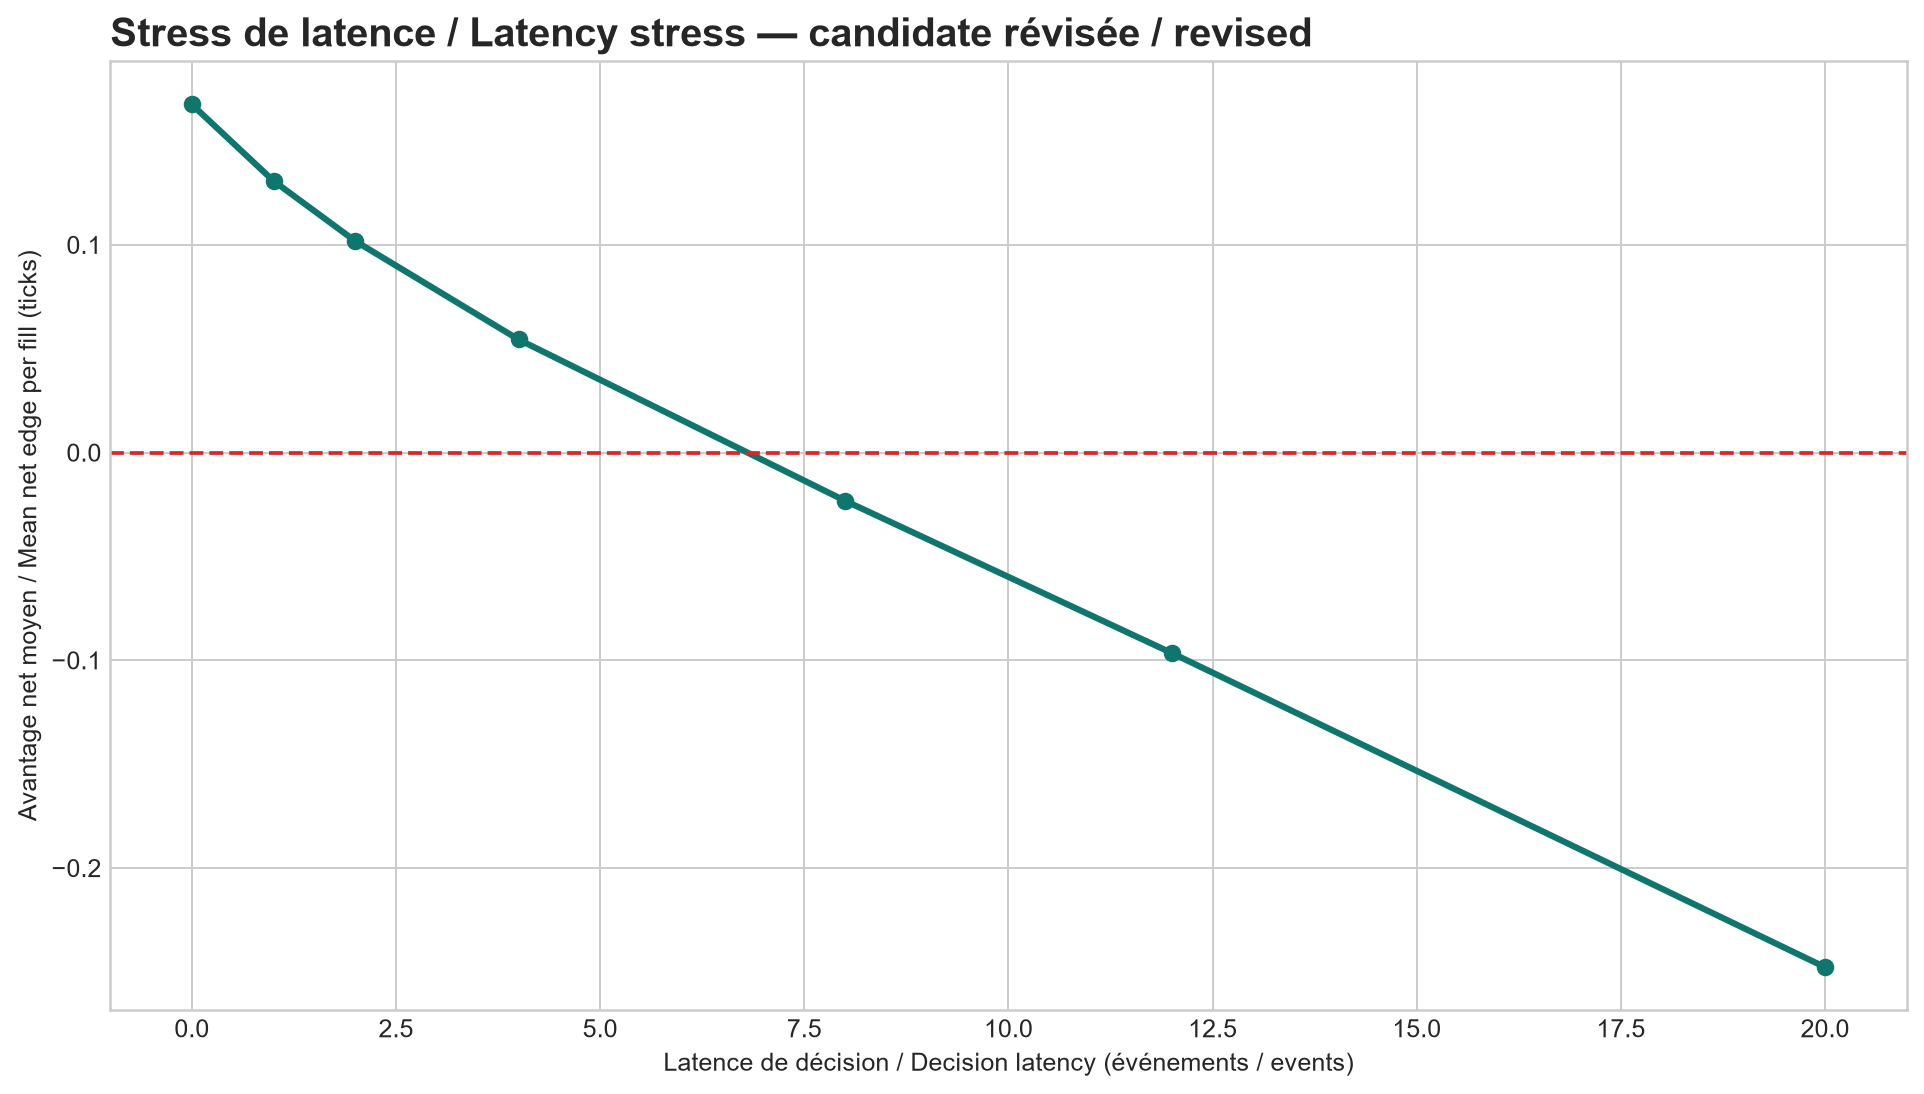
Strategy latency stress
The figure has one panel for the revised candidate. The horizontal axis is decision latency measured in order-book events rather than milliseconds; the vertical axis is mean net edge in ticks per fill. Each dark-teal point is one delay scenario and the line connects those scenarios. Dashed red is the zero break-even threshold. Edge falls from about +0.168 ticks with no delay to +0.055 after 4 events, −0.024 after 8, −0.096 after 12 and −0.248 after 20.
The zero crossing lies between four and eight events; eight is the first tested discrete scenario that is negative. We can conclude that the candidate is highly sensitive to signal freshness and can define an engineering requirement to test in shadow operation. We cannot convert this bound into hardware time without knowing the real event rate, nor guarantee that it remains the same in another market or under a different load.
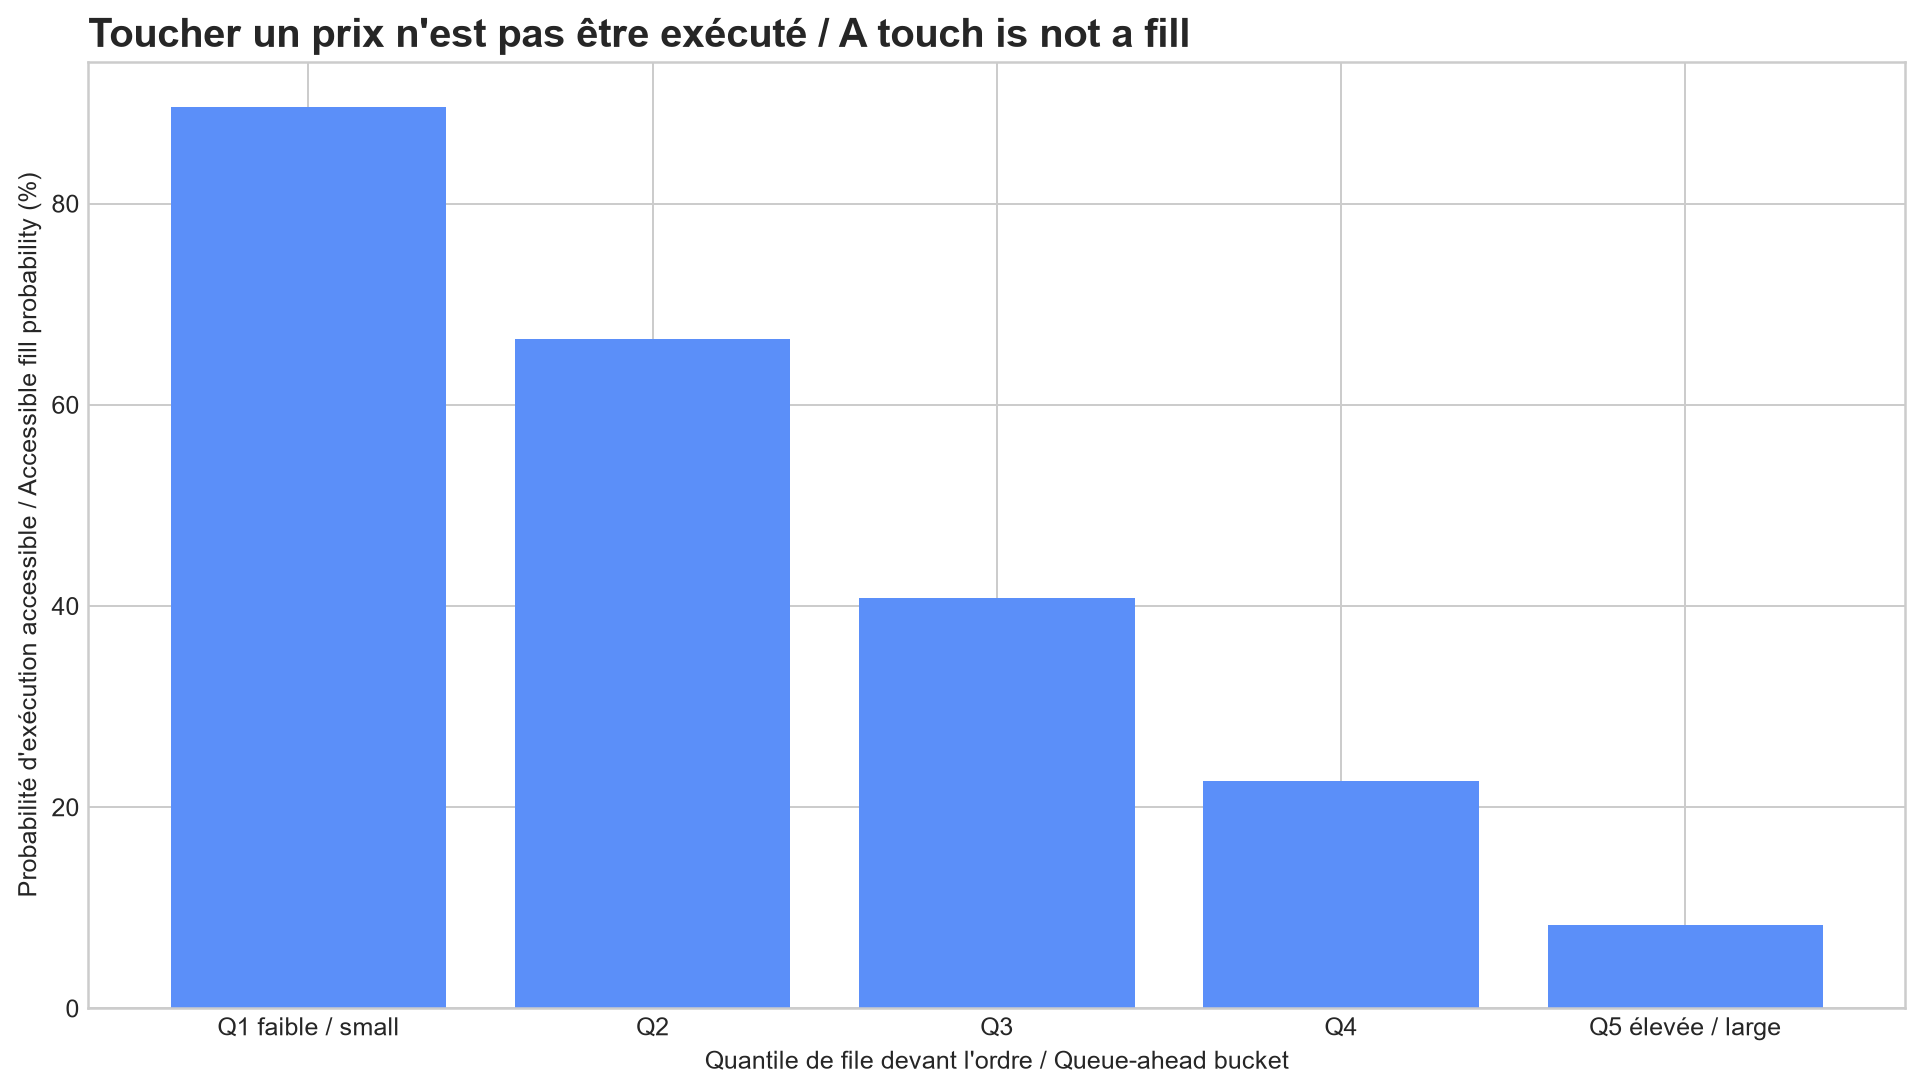
Fill probability by queue depth
The figure has one panel. The horizontal axis groups orders into five buckets by already-prioritised volume ahead, from Q1 'small queue' to Q5 'large queue'. The vertical axis is accessible fill probability in percent. All bars are blue; bar height is the share of orders in that bucket that are ultimately filled in the simulation. The five values are approximately 89.60%, 66.5%, 40.7%, 22.6% and 8.31%.
From the smallest to the largest queue, probability falls by more than a factor of ten. We can conclude that touching the price is not enough: queue position radically changes accessible fill count and must be included in the backtest. We cannot treat these percentages as those of a real venue because order lifetime, cancellations, exact priority and order-book data are synthetic.
07 · Assessment protocol
How the assessment was conducted
Assessment protocol
- 90,000 deterministic order-book events generated with random seed 20260811.
- First replay assumes execution on simple price contact, then adds queue and delay, then applies the filtered rule.
- Signed post-fill price movement after 1, 10 and 50 events.
- Delay sensitivity test and fill probability by prioritised volume.
Limitations that matter
- Market dynamics, adverse selection and delay are entirely modelled.
- One random seed and no separate test set.
- No order lifetime or cancellation, capacity limit or real infrastructure.
- Cumulative ticks are not a monetary profit.
08 · Sources & provenance
Where the facts come from
- Locally generated synthetic best-price-and-volume book — no external market data
09 · Decision
REVISEREVISE — the revised candidate still requires shadow testing.
- 1
The first backtest is rejected: its fill rule creates most of the result.
- 2
The revised candidate is positive in the central scenario but fragile to latency and not tested on an independent dataset.
- 3
The acceptable next step is shadow operation using detailed order-book data, real timestamps and several market periods.
Next step: Revise, then observe the strategy without committing real capital. Any production conclusion requires an order-level book, licensed data and real delay logs.