R7 — turning open-ended exposure into bounded risk
A cross-chain bridge works under normal conditions. The real question is what it loses when its assumptions stop holding.
Protocol, organization, incidents and parameters are entirely synthetic. Deterministic and reproducible simulation.
100,000 synthetic years per designReading plan
From problem to decision
- 01
Follow one transfer
Lock on the source chain, relay proof, mint on the destination chain.
- 02
Identify loss paths
Compromised keys, replayed message, rushed governance or insufficient finality.
- 03
Bound exposure
Caps, delays, replay registry and route-specific rules.
- 04
Form the decision
Compare the available evidence with the conditions required before any pilot.
01
Before we begin
The problem
A reconstructed organization designs R7, a bridge that locks an asset on one blockchain before creating its representation on another.
This study concerns a bridge between two blockchains. Its role is to create on one chain a representation of an asset immobilised on another chain.
The contract on the destination chain cannot directly read the state of the source chain. It must therefore trust evidence carried between the two networks: here, a message signed by authorised keys. Signatures prove that particular keys approved the message; by themselves, they do not prove that its statement is true.
The danger appears if the destination chain creates an asset while the original asset is not truly locked. This can happen when a false message obtains enough compromised signatures, when a deposit observed too early disappears in a source-chain reorganisation, or when the same authentic proof is consumed more than once. In each case the destination contract may follow its rule exactly while acting on false or stale information.
For example, if 100 units are immobilised on chain A but two copies of the same message each mint 100 tokens on chain B, there are 200 redemption claims backed by only 100 reserve units. The bridge has then created an unbacked liability.
02
Phase 1
What the organization built
We begin by understanding the system as presented, without caricaturing it and before proposing any correction.
The transfer, step by step
Imagine 100 units deposited on chain A. A contract places them in a digital vault. Validators observe the deposit and sign a message. A relay program carries that message to chain B, which then creates 100 representative tokens.
Those tokens on B are valid only while the 100 units remain immobilised on A. On the return journey, representative tokens are destroyed on B before the original units are released on A.
This equality is the essential accounting rule: at every point in time, outstanding representative tokens must not exceed the reserve actually locked. The protocol must therefore verify not merely a signature, but also the existence, amount, finality and uniqueness of the reported deposit.
How the initial architecture can mint unbacked tokens
Chain B cannot see the vault on chain A. It sees only a message saying, for example, ‘deposit number 42 locked 100 units on A’. If three stolen keys, or three keys controlled by the same attacker, sign that invented statement, the contract on B sees three cryptographically valid signatures and may mint 100 tokens even though no reserve exists on A. Cryptography authenticates the signers; it does not make a dishonest statement true.
Even with honest signers, a deposit can be observed before it is final. The keys sign, B mints the tokens, and chain A is then reorganised: recent blocks are replaced and the deposit disappears from the accepted history. Without a suitable waiting rule and quarantine procedure, the tokens minted on B do not automatically disappear.
Finally, an authentic message can be submitted twice, or submitted on another route, if its identifier is not recorded as consumed and the signature does not precisely name both chains and contracts. One deposit of 100 may then authorise several mints of 100. A malicious relay can attempt those submissions; it should succeed only when the destination contract's checks are incomplete.
One relay program carries messages, every route waits twelve blocks and no cap limits total value, individual transfers or hourly throughput. The same fault can therefore be repeated several times before the team detects it and stops the system.
What ‘three signatures out of five’ means exactly
The number five does not come from chains A or B. It is a choice in the reconstructed architecture: the contract on B stores a list of five authorised public keys, ideally held by five separate operators and technical environments. Each observes the same deposit on A and may sign its identifier, amount and destination.
The contract accepts any group of three distinct keys out of those five; these are not three signers selected in advance. The threshold keeps the service operating when one or two keys are unavailable, because at least three remain. It also prevents one or two compromised keys from fabricating an authorisation by themselves.
The trade-off is exact: as soon as an attacker controls three keys, that attacker reaches the threshold and can sign a fictitious deposit. The key count therefore helps only when operators, software, secrets and infrastructure are genuinely independent. Five keys held in one environment may fall to one correlated compromise. Three out of five is a design assumption to assess here, not a universal guarantee.
Initial approach summary
- The prototype appoints five bridge-specific signing keys; the destination contract accepts any group of three distinct keys. It therefore continues with two unavailable keys, but three compromised keys can sign a fictitious deposit.
- One program alone carries messages between chains.
- Every chain pair waits exactly twelve confirmations despite different reorganisation risks.
- No global registry explicitly prevents the same proof from being consumed across multiple routes.
- No limit caps total value, an individual transfer or hourly throughput.
03
Phase 2
What the assessment checks and proposes
The second phase reproduces the mechanism, locates what breaks and turns criticism into a testable change.
Reduce common-compromise risk
The synthetic redesign replaces five keys with a threshold of three by seven keys with a threshold of four. More importantly, it requires the four necessary signatures to come from separate failure environments: operators, secrets and infrastructure must not share one compromise point.
Under this threshold, three unavailable keys can be tolerated and three stolen keys cannot fabricate an authorisation; four compromised keys still can. Moving from five to seven is therefore not, by itself, proof of safety. Genuine independence among key holders must be documented, tested and audited.
Separate speed from final creation
The proposal no longer asks final minting to be fast. A liquidity provider may temporarily advance funds to the user at its own risk, while canonical minting waits for source-chain finality.
Each route receives a confirmation count suited to its speed and reorganisation profile. The message includes the chains, contract and operation identity; a global registry prevents it from being consumed twice.
Turn open loss into a cap
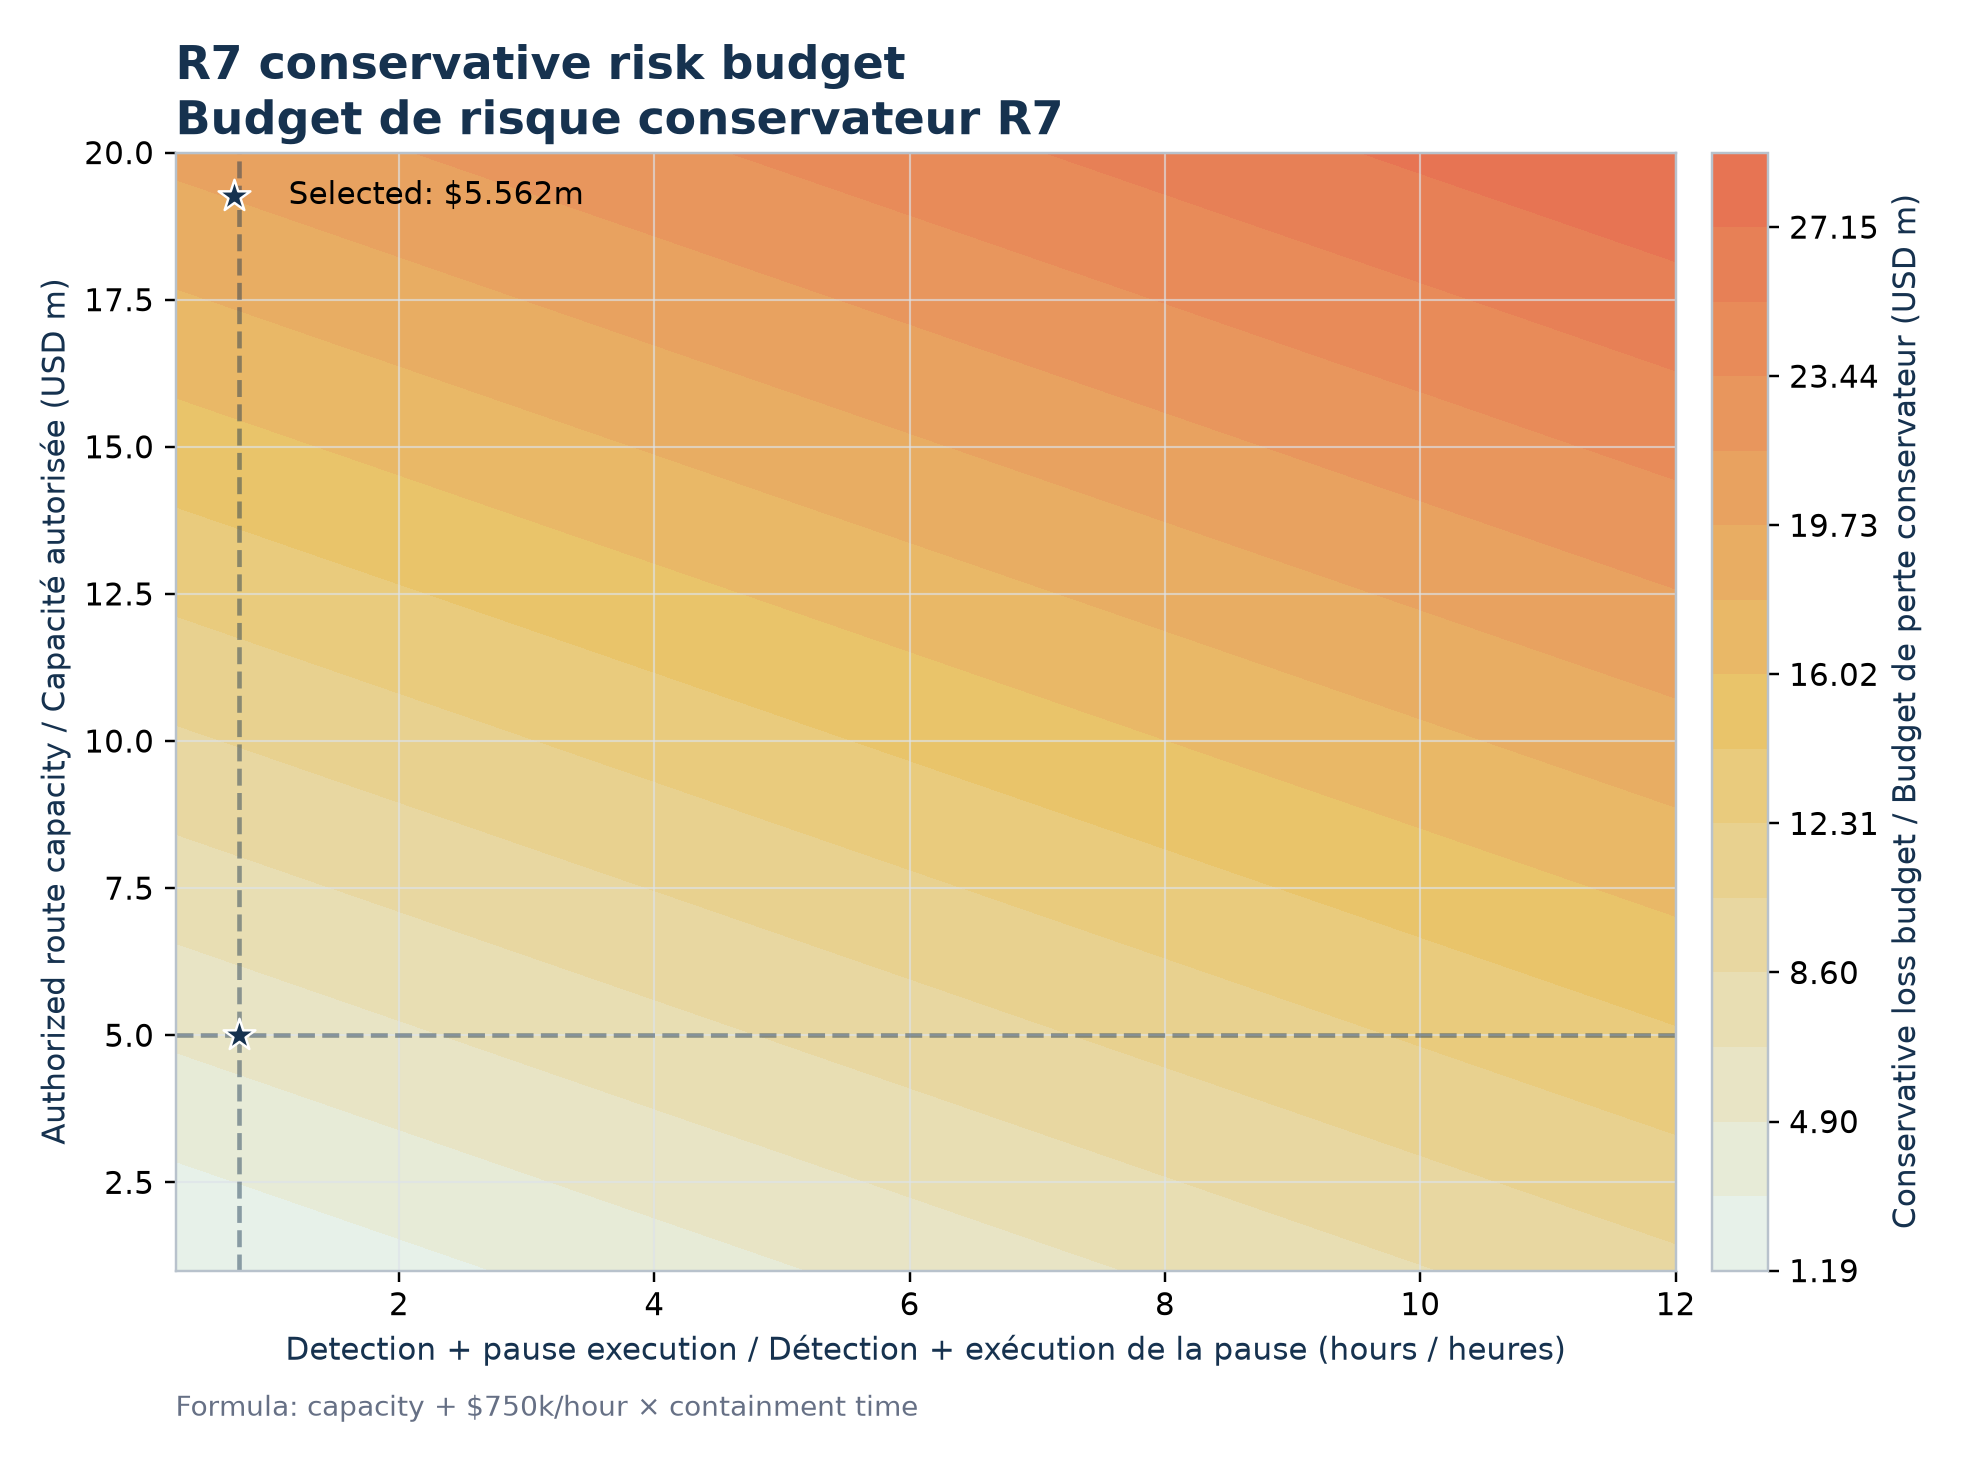
Three limits accumulate: USD 500,000 per transfer, USD 750,000 per hour and USD 5 million per route. A 48-hour delay prevents a governance change from becoming executable immediately.
The simulation then measures the frequency of loss years, mean loss and the 99th percentile. This percentile is not an absolute maximum: roughly one simulated year in one hundred is worse.
Assessment
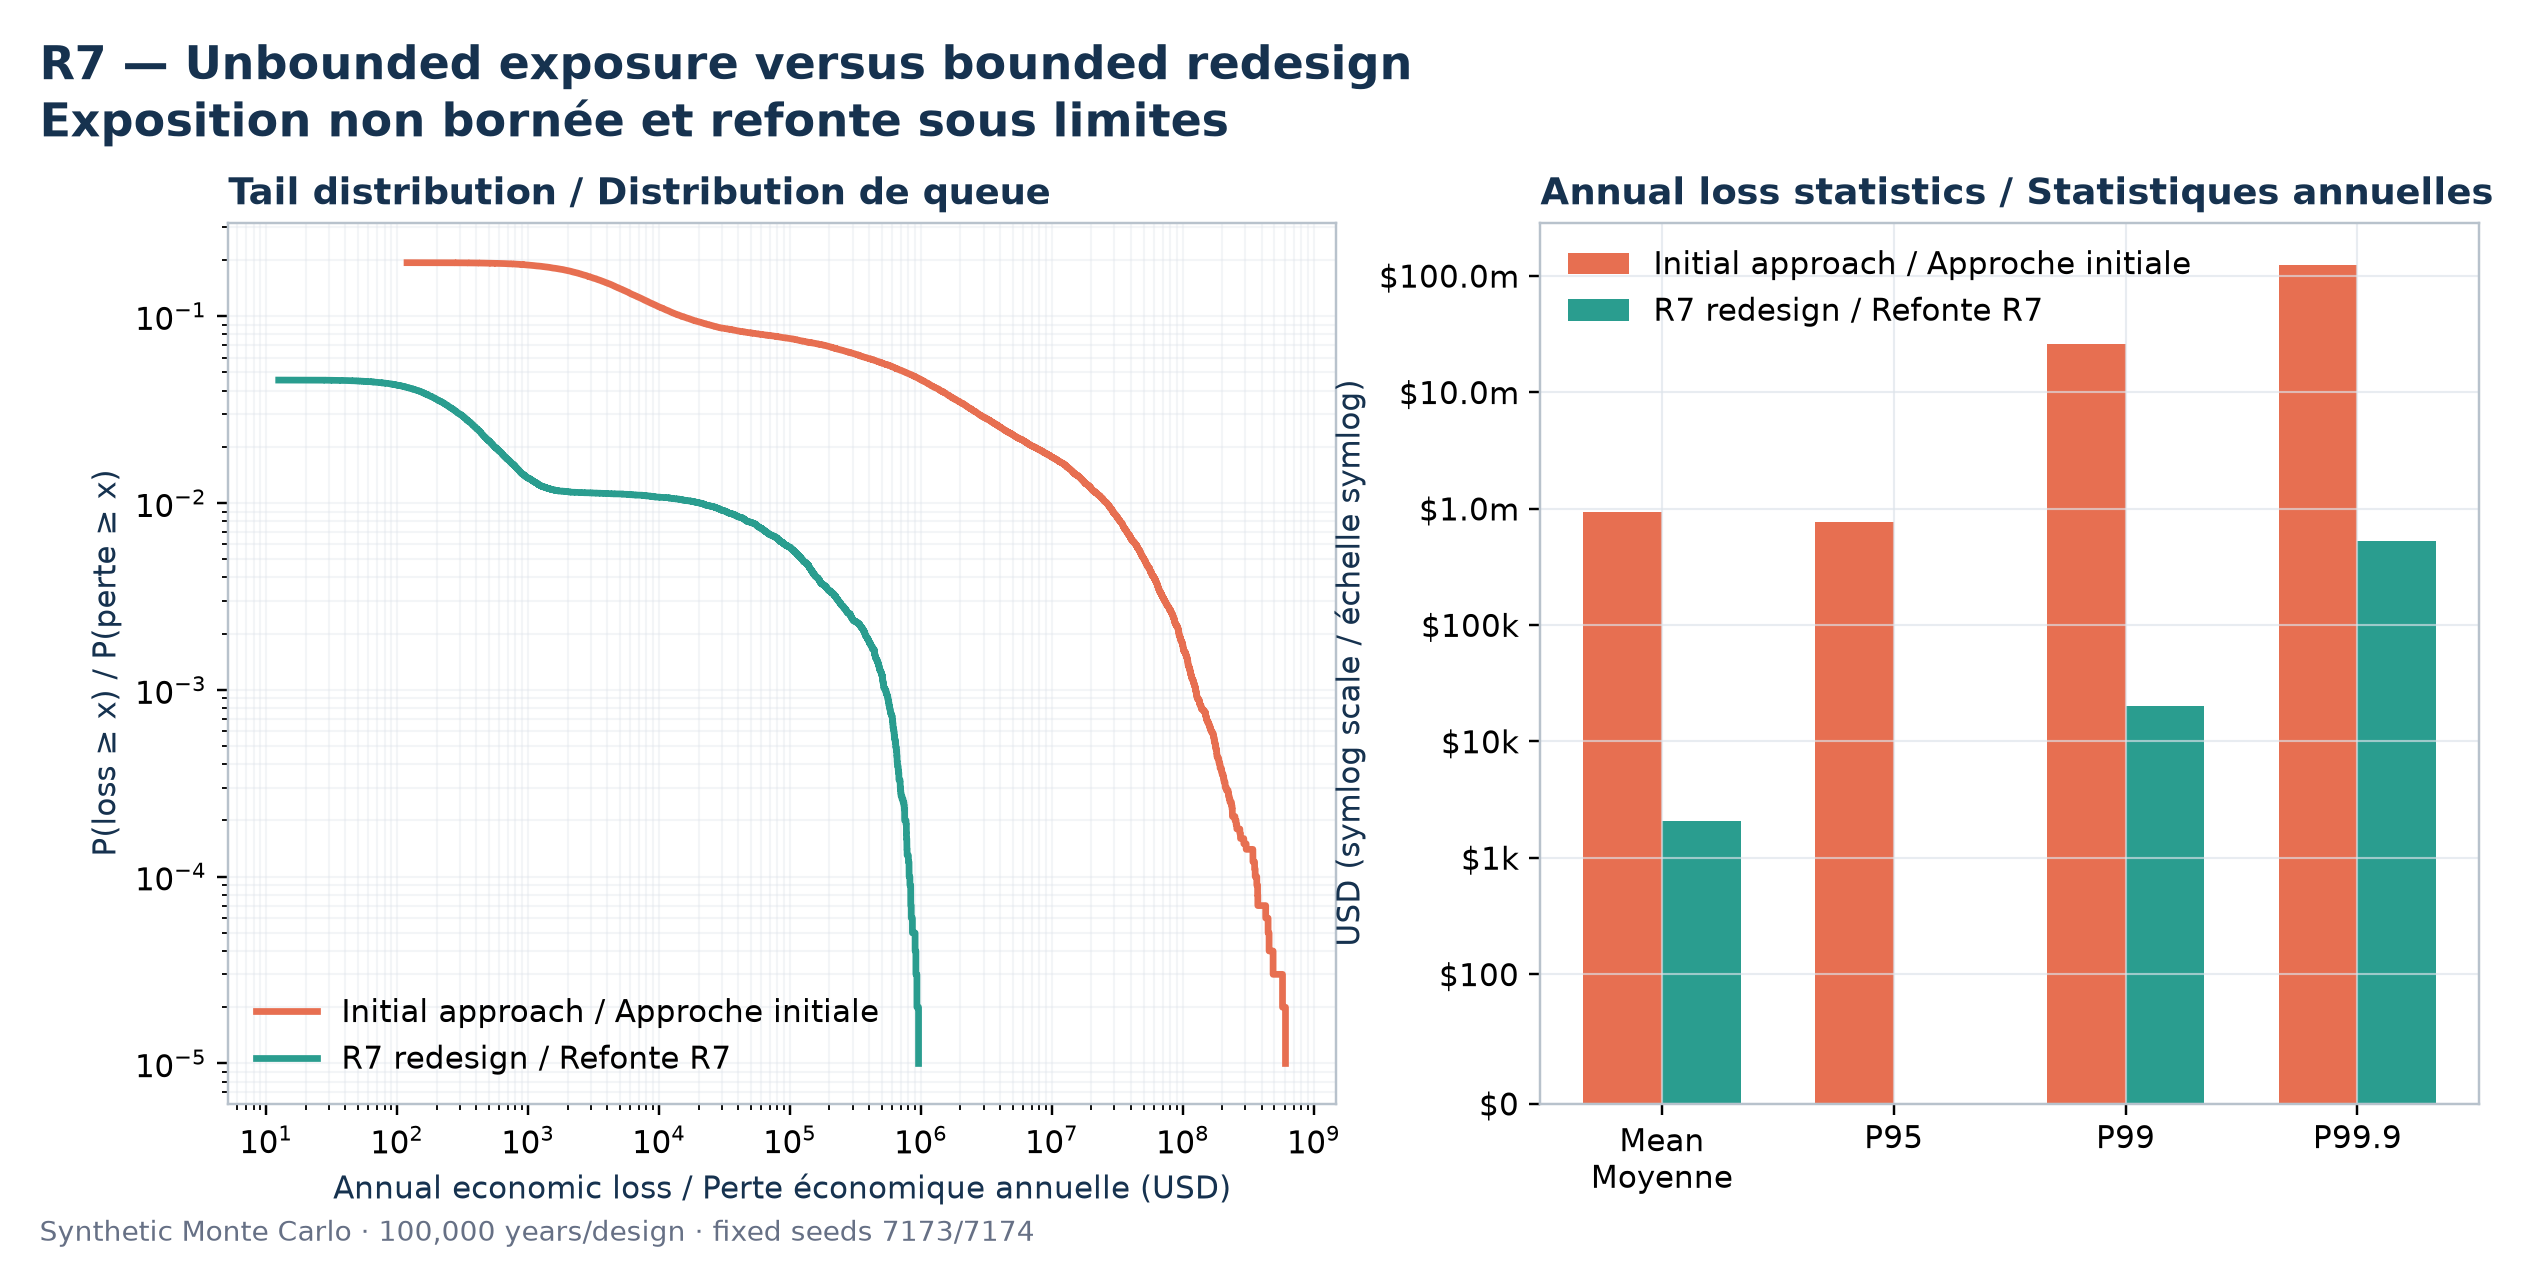
- Under the disclosed assumptions, the initial approach produces a USD 931,583 mean annual loss; 99% of simulated losses remain below USD 26.06 million, but 1% exceed it.
- The destination chain cannot see the original deposit directly: it acts on a message. A false message signed by three compromised keys, a deposit removed by a reorganisation or an authentic proof replayed more than once can therefore mint more tokens than the assets locked.
- The uniform waiting rule and immediately executable governance worsen this exposure, which is capped by no value or throughput limit.
- These numbers describe a synthetic model, not a deployed protocol.
Proposed correction
- The redesign proposes seven keys, requires four signatures and separates them across four independent failure domains; four compromised keys can still reach the threshold, which must be audited.
- Each message precisely names its chains, contract and operation; a global registry prevents it from being consumed twice.
- Confirmation count is tailored to each chain pair.
- Every governance change waits 48 hours; emergency power may only pause the system.
- Caps are set at USD 5 million per route, USD 500,000 per transfer and USD 750,000 per hour.
- A liquidity provider may advance funds while final creation waits for finality.
04
Concepts and equations
No symbol without a definition
The same notes open from the “?” links placed throughout the article.
05
Numerical results
What the numbers actually measure
The amounts below come from a simulated world. They compare two architectures under the same reading rules; they do not predict a real loss.
simulated years with loss
Frequency of years in which at least one loss occurs.
mean annual loss
Average over 100,000 synthetic years per design.
99th loss percentile
99% of simulated losses are lower; 1% are worse.
operational incident bound
Cap implied by transfer, throughput and response limits.
06 · See the evidence
Read the charts step by step
Each figure first explains how to read its axes and colours, then what it does—or does not—support.
Initial and redesigned loss distributions
The figure has two panels. In both, coral represents the initial design and teal the R7 redesign; there is no blue series. On the left, the horizontal axis is an annual economic-loss threshold in US dollars: farther right means a larger amount. The vertical axis is the probability that one year loses at least that amount: a higher curve means that exceedance occurs more often. Both axes are logarithmic, so equal spacing represents a tenfold multiplication rather than the addition of a fixed amount. On the right, the horizontal axis lists the mean and the 95th, 99th and 99.9th percentiles; the vertical axis gives their dollar value on a scale that compresses very large differences. The teal 95th-percentile bar remains at zero and therefore appears absent: this is not missing data, but a consequence of fewer than 5% of redesigned years recording any loss.
The coral curve stays above the teal curve and extends much farther to the right: in this simulation, the initial design produces losses that are both more frequent and much more severe. The right panel confirms the gap for the mean and for adverse years. This reading compares two synthetic worlds of 100,000 years; it measures no observed incident frequency and does not guarantee that real extreme events follow these curves.
Attack-scenario comparison
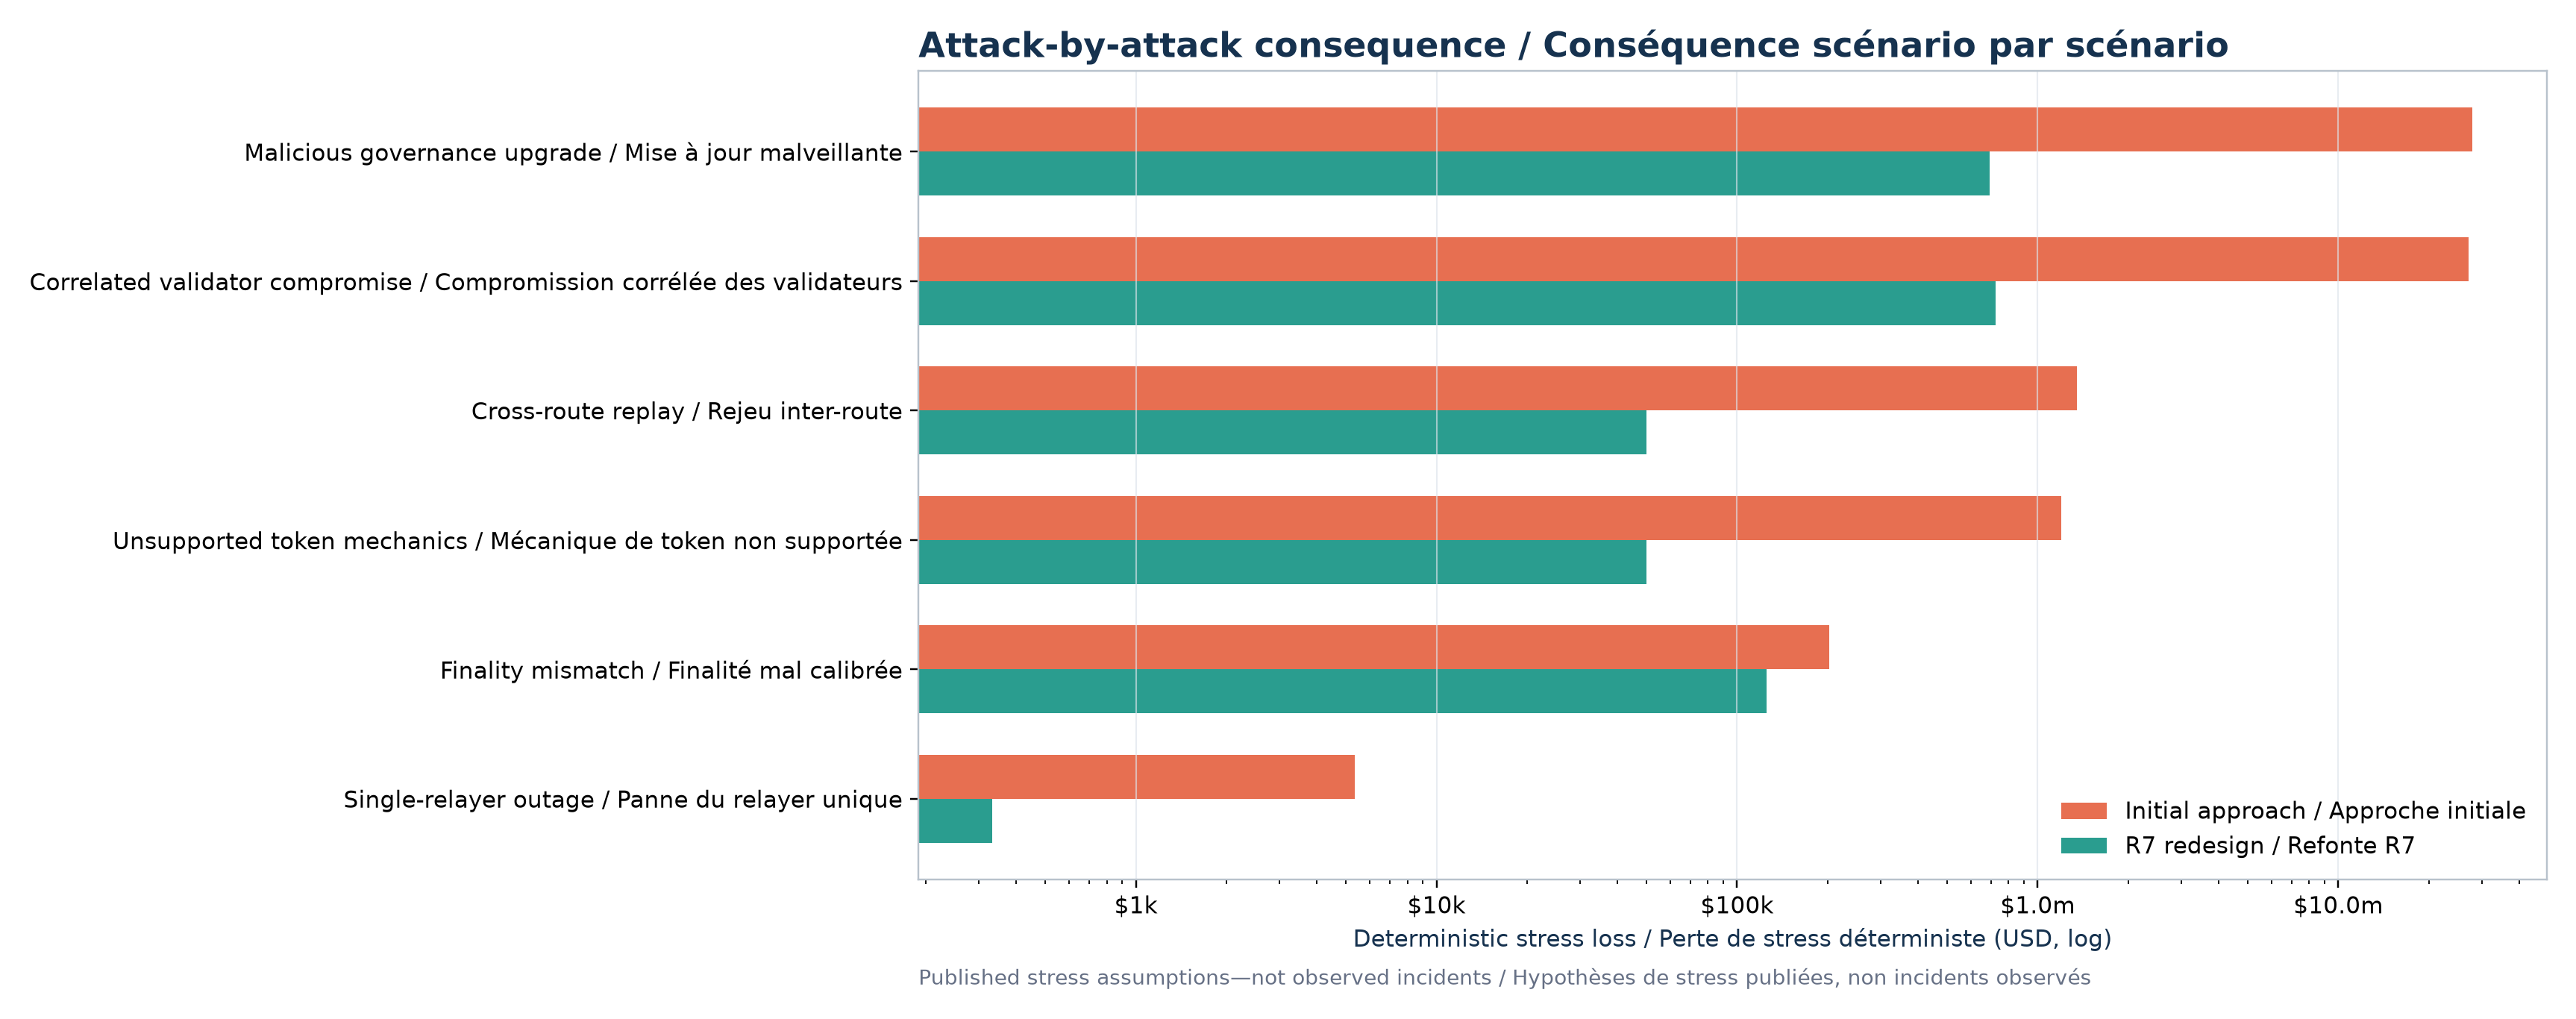
The vertical axis is not a number: it lists six stress scenarios, from a single-relay outage to correlated validator compromise and a malicious governance upgrade. On each row, the coral bar is the calculated consequence under the initial design and the teal bar is the consequence after redesign. The horizontal axis gives deterministic loss in US dollars if that scenario occurs; a bar extending farther right therefore means a more costly consequence. This axis is logarithmic: moving from USD 100,000 to USD 1 million takes the same space as moving from USD 1 million to USD 10 million. The two colours should be compared within one row, with the logarithmic scale kept in mind.
The redesign reduces the modelled consequence in all six scenarios, but does not eliminate it. A finality mismatch falls relatively little, while malicious governance and multi-key compromise retain losses of several hundred thousand dollars: these are residual risks to address. The bars describe loss conditional on a fixed stress scenario; they state neither how often the scenario will occur nor that these amounts are absolute maxima.
Risk-budget surface
The horizontal axis measures, in hours, the time from the start of an incident through detection to effective execution of the pause. The vertical axis measures maximum authorised route capacity in millions of US dollars. Colour gives the conservative loss budget at each point, also in millions: pale tones are lower amounts and dark orange tones are higher amounts. The published calculation is ‘authorised capacity + USD 750,000 per hour × containment time’. Dashed lines mark the redesign choice of USD 5 million capacity and roughly 0.75 hours of response; their intersection produces USD 5.562 million, repeated by the legend star.
Moving upward increases the value already exposed; moving right lets more value cross before the pause. Reducing either input therefore mechanically lowers the calculated bound. This visual is an engineering sizing rule, not a statistical distribution: it assumes the USD 750,000 hourly limit is enforced, the pause works at the stated delay and no other loss path bypasses the caps.
Application-suitability matrix
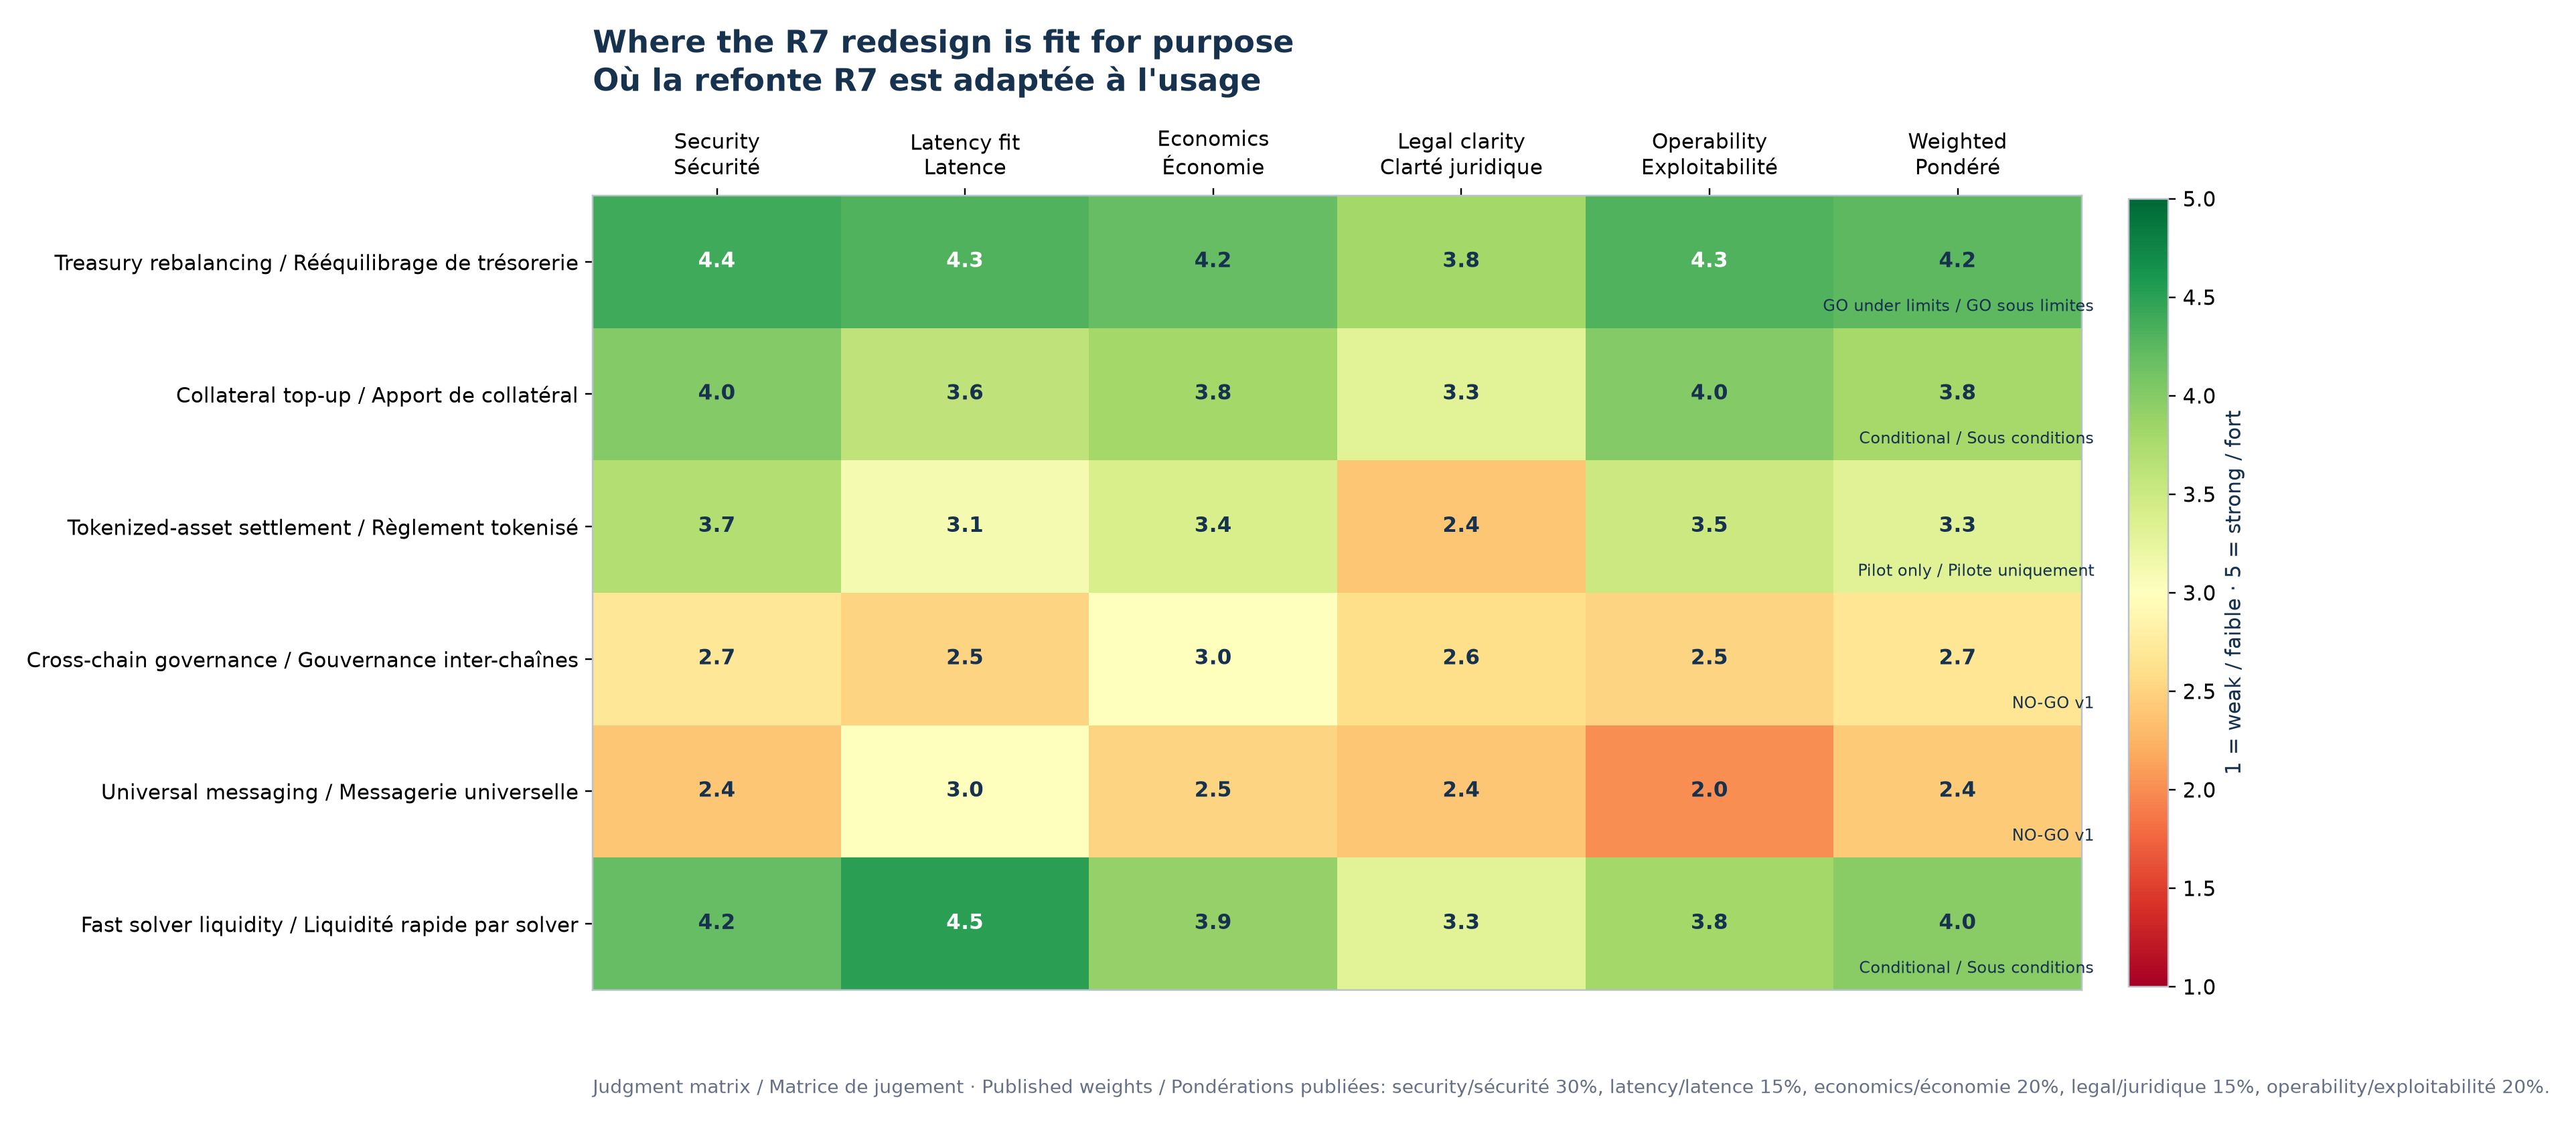
Here, rows act as a categorical vertical axis: each is a possible use, such as treasury rebalancing, collateral top-up or cross-chain governance. Columns act as the horizontal axis: security, latency fit, economics, legal clarity, operability and then the weighted score. The number in each cell runs from 1, weak, to 5, strong. Colour repeats that information: red and orange for weak scores, yellow for intermediate scores and green for strong scores. The final score combines the five criteria using the weights printed below the chart; the right-hand label then translates it into ‘under limits’, ‘conditional’, ‘pilot only’ or ‘rejected’.
Capped treasury rebalancing receives the strongest score, while cross-chain governance and universal messaging remain rejected. Tokenised-asset settlement is presented only as a pilot, notably because legal clarity scores lower. The scores and weights are explicit judgements constructed for this study; they are neither field measurements, legal advice nor security certification.
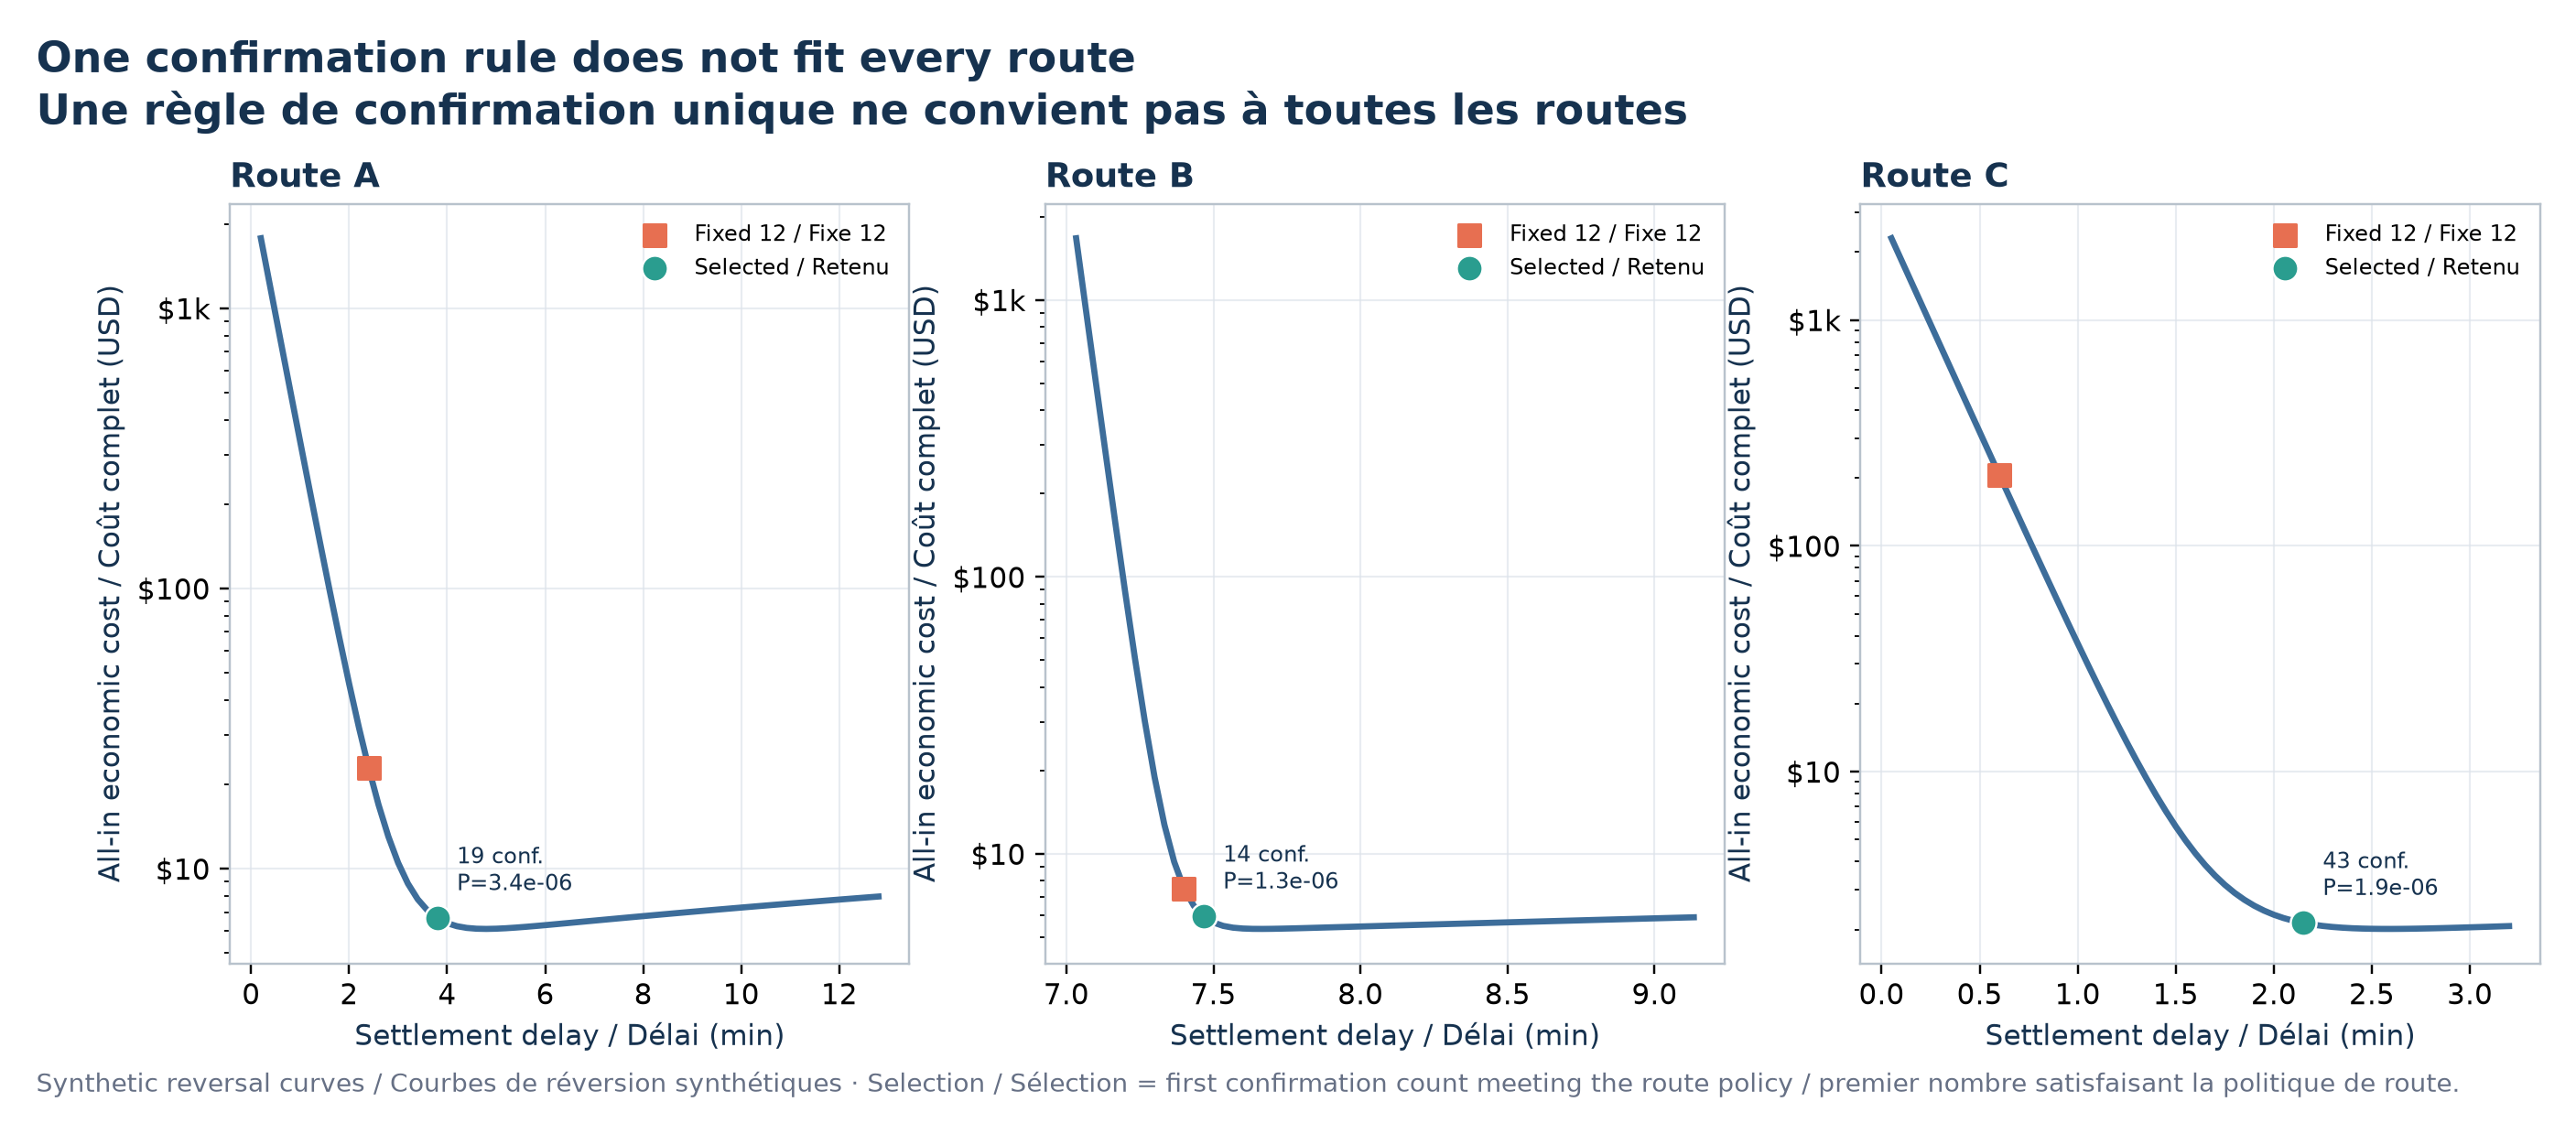
Finality, delay and cost trade-off
The three panels represent three synthetic routes with different speeds and reorganisation risks. In each panel, the horizontal axis measures settlement delay in minutes: more confirmations move the point to the right. The vertical axis measures all-in economic cost in US dollars and uses a logarithmic scale. The blue curve adds expected reorganisation loss, relay cost, tied-up capital and waiting cost; it falls at first as confirmations sharply reduce risk, then rises slightly when delay cost dominates. The coral square is the initial fixed rule of twelve confirmations. The teal circle is the first confirmation count satisfying that route's risk policy; its annotation gives the count and the synthetic residual reorganisation probability.
The selected counts differ markedly: 19 confirmations for route A, 14 for B and 43 for C. Twelve confirmations are therefore insufficiently safe for some routes, while adding confirmations indefinitely eventually stops reducing risk enough to offset delay. The curves rely on reorganisation probabilities invented for the demonstration; they show how to frame the trade-off, not which counts to use on a real chain.
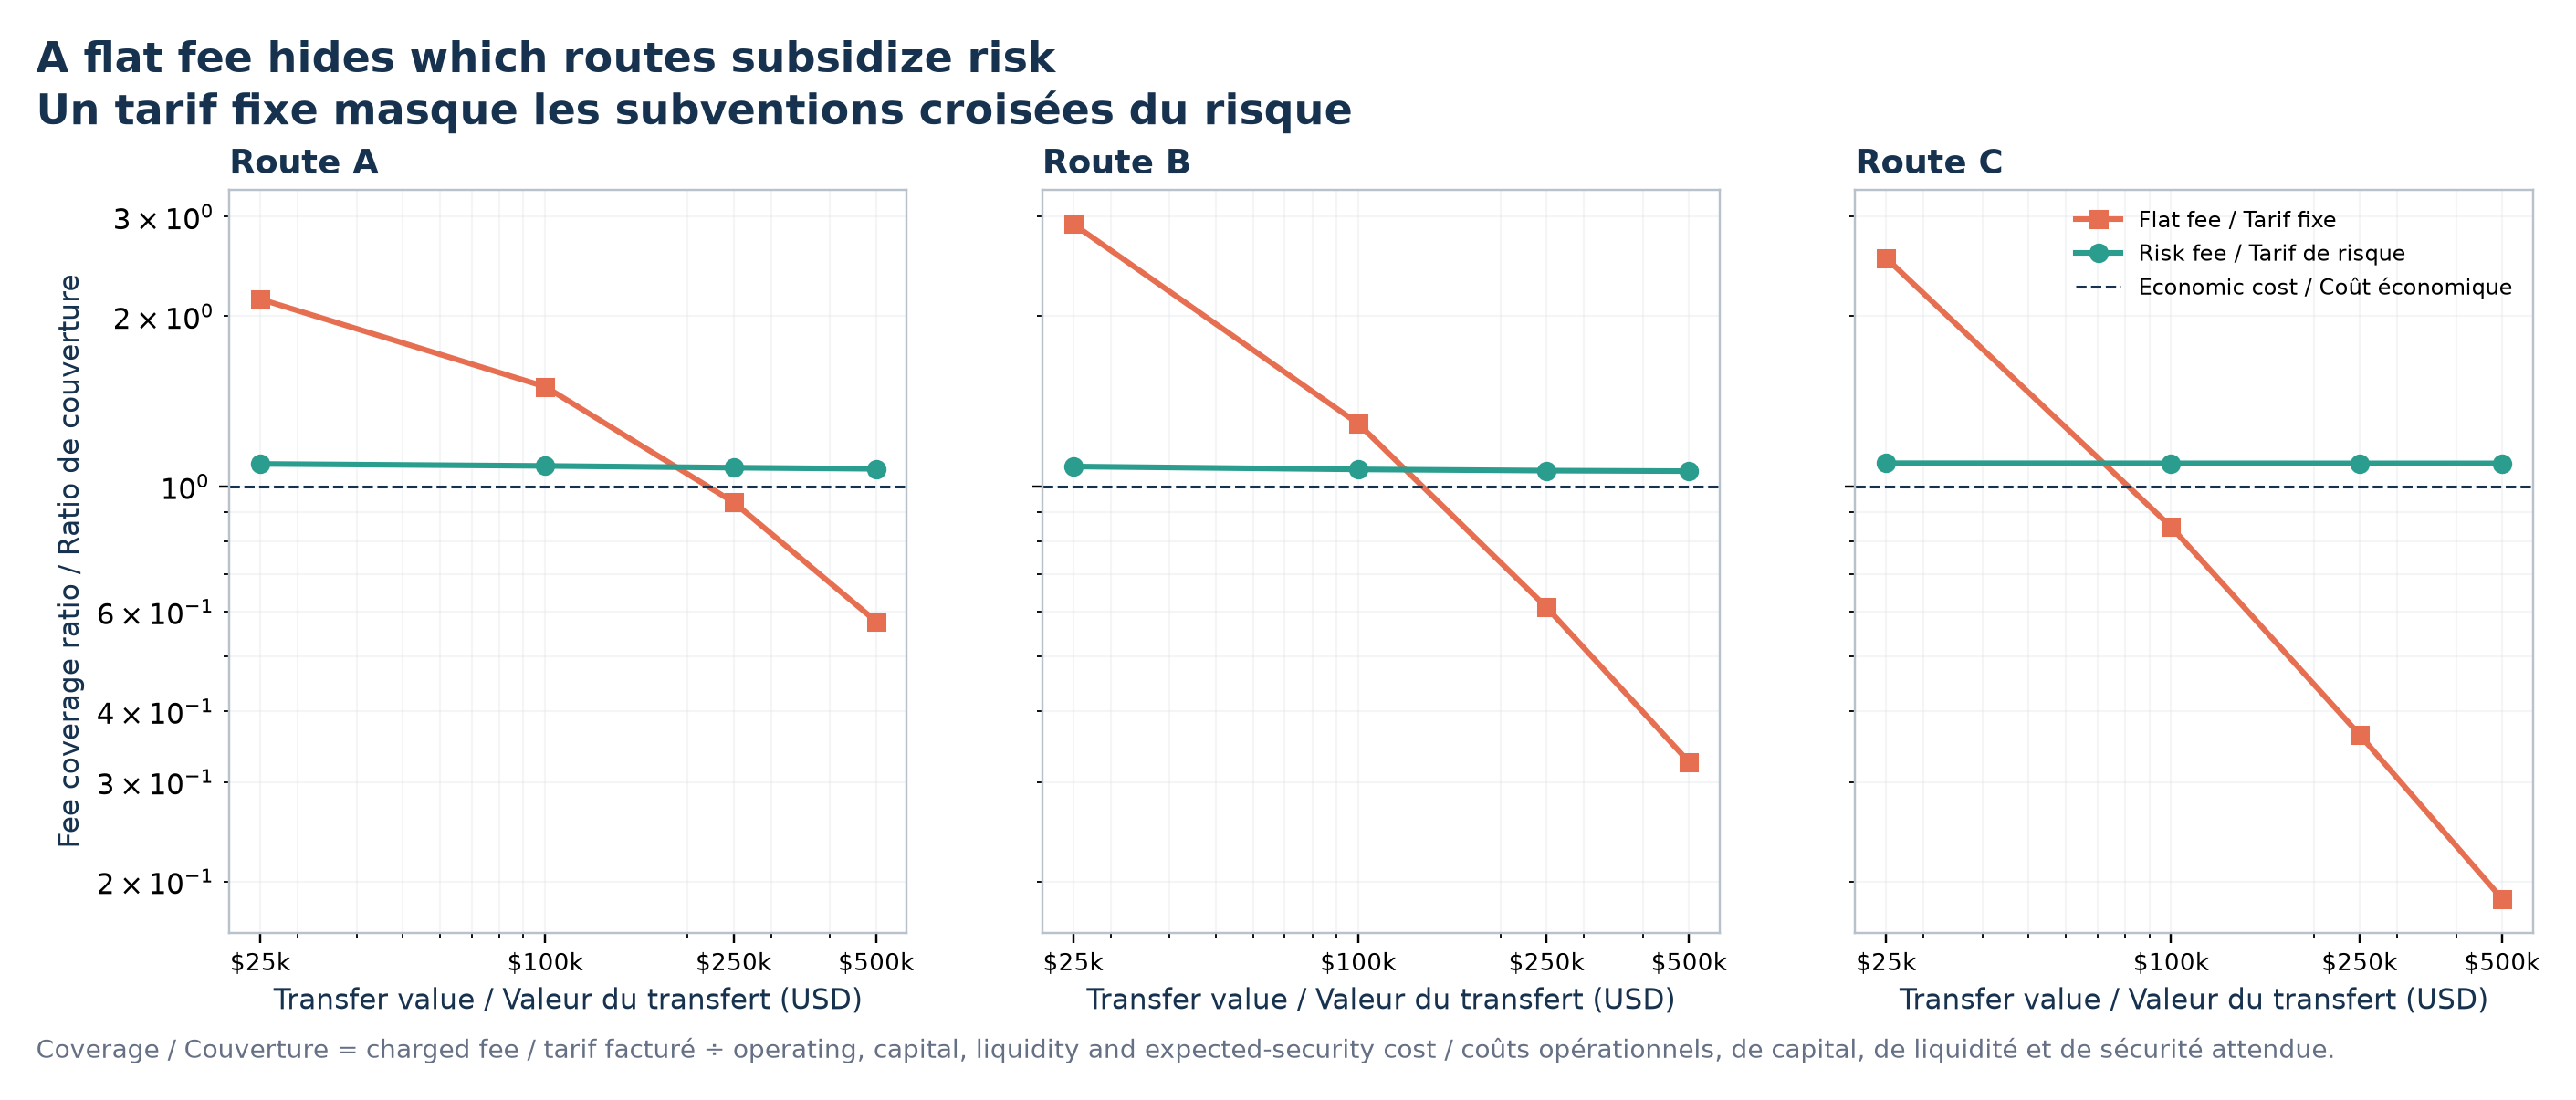
Economic fee coverage
Each panel represents one route. The horizontal axis gives transfer value in US dollars, from USD 25,000 to USD 500,000. The vertical axis is a unitless ratio: charged fee divided by modelled economic cost, including operations, capital, liquidity and expected security cost. The dashed line at 1 is break-even: above it, the fee charges more than estimated cost; below it, the fee fails to cover that cost. Coral squares represent the initial USD 12 flat fee and teal circles the risk-linked fee. The vertical scale is logarithmic, making ratios far below and far above 1 comparable.
The coral flat fee overcovers small transfers and then underfunds large ones, with a gap that also varies by route. The teal fee remains slightly above 1, roughly 1.06 to 1.10, because it is constructed from each transfer's cost. This illustrates the hidden subsidies of flat pricing; it does not establish that modelled cost, selected margin or real demand is correctly estimated.
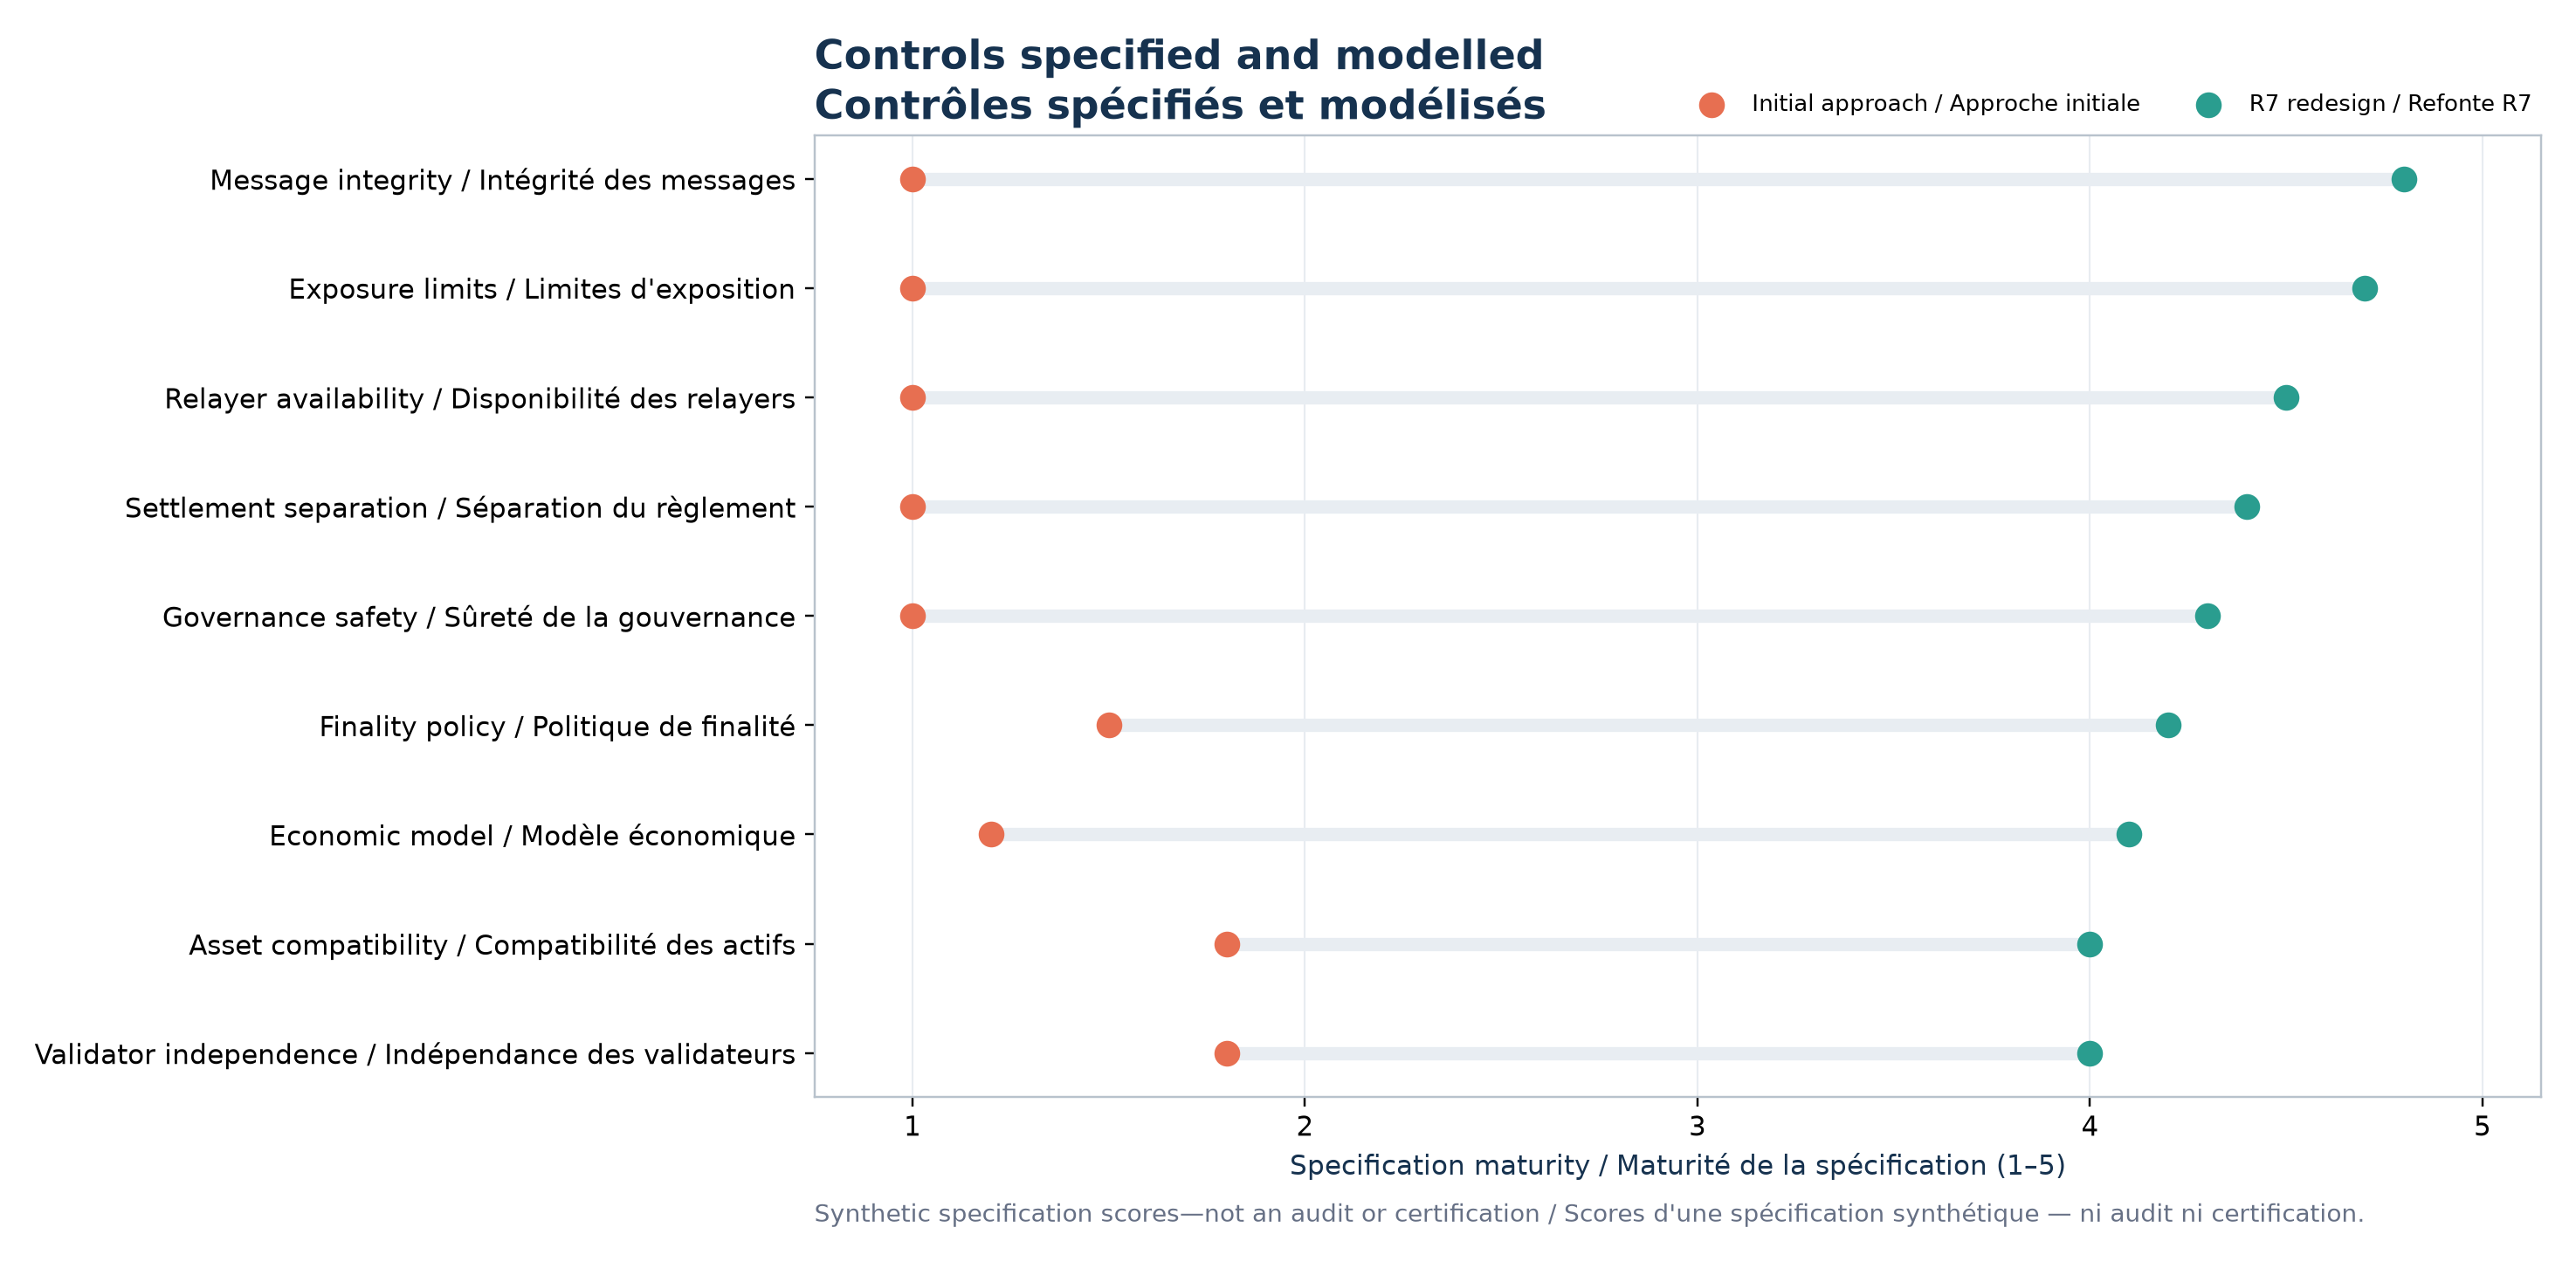
Maturity of specified and modelled controls
The vertical axis lists nine control families: message integrity, exposure limits, relay availability, settlement separation, governance, finality, economic model, asset compatibility and validator independence. The horizontal axis is a synthetic specification-maturity score from 1 to 5; a point farther right means that the control is described and modelled more precisely in the dossier. On each row, coral is the initial design, teal is the redesign and the grey segment shows the gap between them. A relay is the program submitting a message from one chain to another. The axis has no physical unit or observed frequency: these are review scores.
Every family moves right, especially message integrity, caps and relay availability, which started from an almost absent specification. Validator independence reaches only a more mature description; the chart does not prove that the seven operators are genuinely independent. A better-scored specification may still contain implementation errors: this visual replaces neither executable code, incident testing nor independent audit.
07 · Assessment protocol
How the assessment was conducted
Assessment protocol
- Two 100,000-year simulations, initialised with random seeds 7173 and 7174.
- Six incident families; their frequencies, severities and exposed amounts are entirely parameterised.
- 2,352 combinations of caps, throughput and response time.
- 192 waiting policies and 12 fee scenarios.
- A transfer is represented through fifteen successive states.
Limitations that matter
- All probabilities and severities are demonstration assumptions.
- Redesign gains partly rely on improved assumptions by construction.
- The two simulations do not use exactly the same random draws year by year.
- No executable contract, test network, audit or exhaustive mathematical proof of the code.
08 · Sources & provenance
Where the facts come from
09 · Decision
NO-GOInitial NO-GO — capped pilot only after redesign and independent code audit.
- 1
The initial architecture allows an error or three compromised keys to create uncapped exposure: it is rejected.
- 2
The redesign sharply reduces simulated losses through explicit caps and delays. Part of the improvement nevertheless comes from assumptions chosen for the redesign.
- 3
Before a pilot, executable code, trials on a test network, checks that essential accounting rules always hold and an independent audit are still required.
Next step: The original design is rejected. Under the model assumptions only, the redesign reduces mean annual loss to USD 2,079 and its 99th percentile to USD 20,122. A pilot remains conditional on an independent code audit.